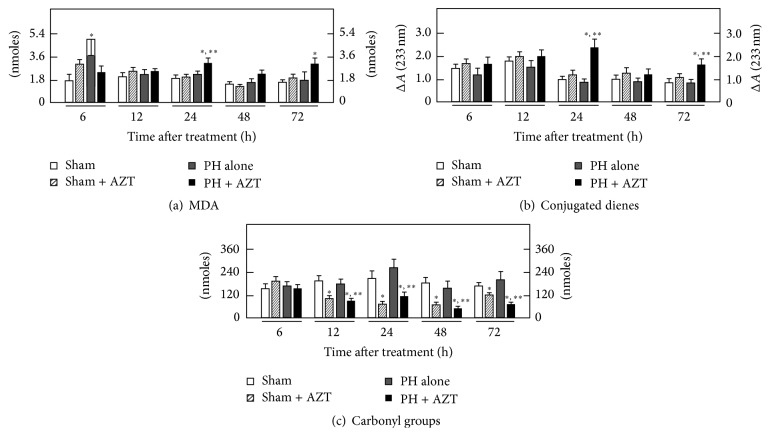
Figure 6.
Effects of AZT on parameters indicative of oxidant stress in nuclei obtained from livers at various times after 70% PH. Results are expressed as mean ± SE for four independent determinations per experimental point as nmoles·mg−1 of protein in panels (a) to (c). Symbols for the experimental groups at the bottom of each figure and the statistical significance as indicated in Figure 1.

