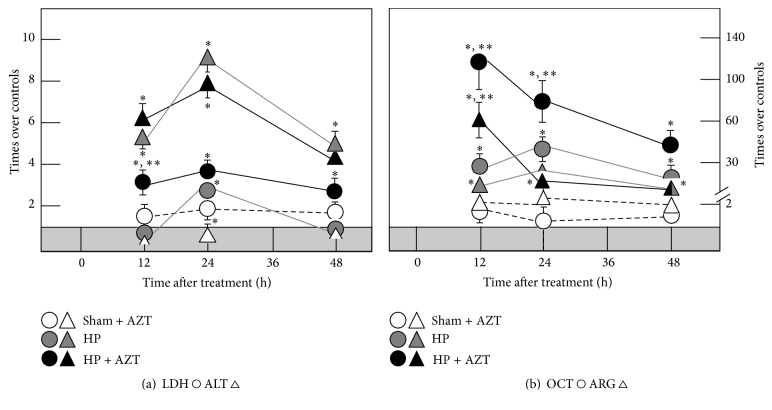
Figure 7.
Effects of AZTon serum enzyme activities in samples obtained at several times after 70% PH. Results of serum enzyme activities are expressed as mean ± SE mean of four independent determinations per experimental point. In both panels, the shadowed horizontal bar represents the range of serum enzyme activities for controls (Sham): ALT 20 ± 3, LDH 570 ± 90, OCT 2.1 ± 0.3, and Arginase, 4.5 ± 0.7 IU/L. Symbols for the experimental groups at the bottom of each figure. Statistical significance as indicated in Figure 1.

