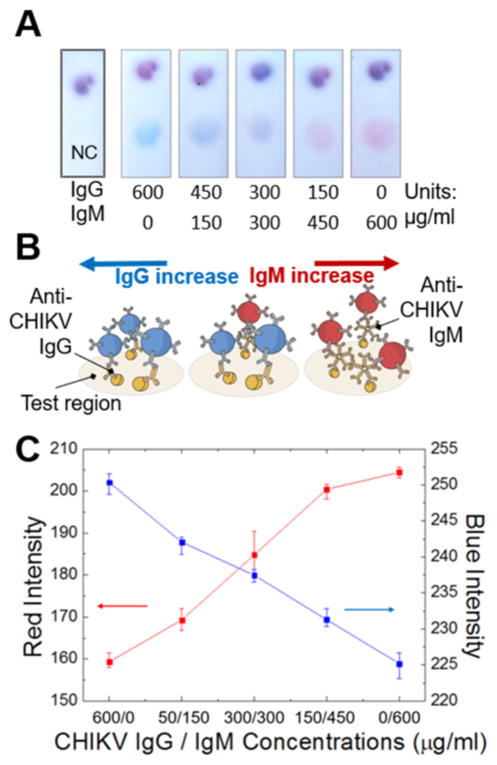
Figure 2.
Single-spot duplex IgG/IgM test for Chikungunya. (A) Color development on the test region of the two-color assay. (B) Schematic details of the test region interactions where blue and red colors correspond to the colored probes that have interacted with the anti-CHIKV IgG and IgM, respectively. (C) Image analysis for red and blue intensities on the test regions at different anti-CHIKV IgG/IgM concentrations.

