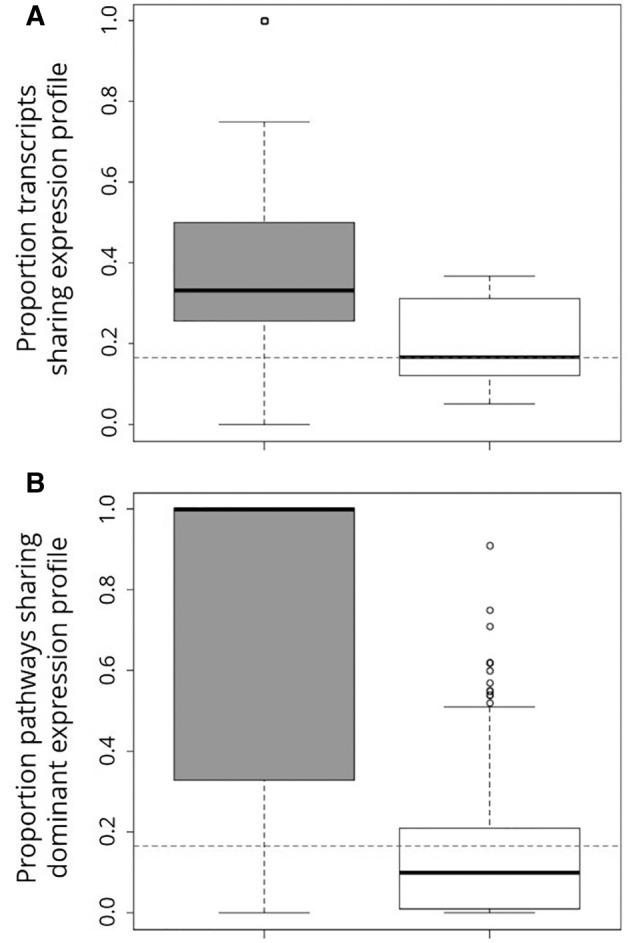
Fig. 4.—

Boxplot depicting relationship between expression profile and shared functional annotation in Ambystoma. (A) Differentially expressed transcripts share expression profiles with a significantly higher proportion of other differentially expressed transcripts within the same biochemical pathway (gray box) than they do with differentially expressed transcripts from other pathways (white box) (Mann–Whitney U = 13,219, P < 2.2 × 10⁻¹⁶). (B) Pathways that share a GO term (gray box) are significantly more likely to share a dominant expression profile than pathways that do not share that GO term (white box) (Mann–Whitney U = 51,912, P < 2.2 × 10⁻¹⁶). For both panels, thick black lines represent median values, boxes represent inner quartile ranges, and whiskers represent outer quartile ranges. The null expectation for genes/pathways sharing an expression rank order by random chance is shown by the dashed horizontal line.
