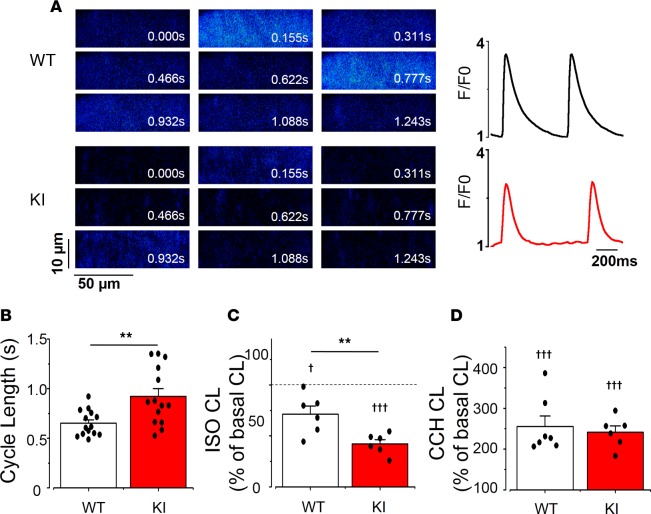
Figure 3. Cycle length (CL) in sinoatrial node (SAN) in KI is longer than in WT.
(A) Examples of 2-D confocal images (left) of SAN cells within the intact SAN, and the corresponding fluorescence traces (right) in WT (upper) and KI (lower) SAN cell. Fluorescence traces are expressed as F/F0, where F is the fluorescence signal and F0 the fluorescence during the diastolic period. (B) KI mice have markedly longer cycle lengths (CL; time between two consecutive spontaneous [Ca2+]i transients) than WT, from n = 14 WT and n = 14 KI SAN cells. (C) Isoproterenol (ISO, 20 nM) decreases SAN CL, although irrespective to the clinical group, as the response in KI SAN (n = 6) is larger than in WT (n = 6). (D) Carbachol (CCH, 500 nM) increases CL in each SAN, and no statistical difference was observed between WT (n = 7) and KI (n = 6) SAN cells. Each bar displays mean value ± SEM of the node (white for WT and red for KI) with individual data shown on the columns, while each SAN is averaged from several cells (4–13 cells in each SAN). Stars correspond to the comparisons between groups, while crosses show the comparisons inside each group before and after the administration of the drug. †P < 0.05; **P < 0.01; †††P < 0.001 by two (stars) or one (crosses) sample t test. KI, heterozygous for the RyR2R420Q mutation.

