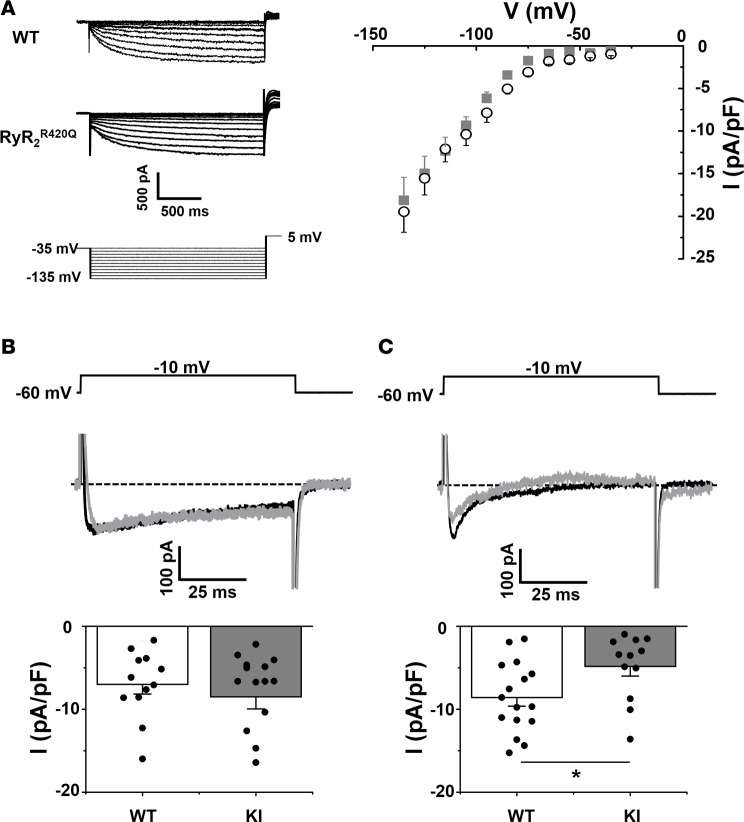
Figure 4. If is normal, but ICaL is diminished in KI SAN cells.
(A) Left, family traces of If in a WT (top) and RyR2R420Q (middle) cell, with the voltage protocol below. Right, If current density–voltage relationship in 8 WT cells (open black circles) and 8 KI cells (gray squares). (B) ICaL peak current density is unchanged recorded at –10 mV with a 10 mM BAPTA Ca2+ buffered intracellular solution, in 12 WT and 15 KI SAN cells. Sample traces at –10 mV and voltage protocol are shown on top. Bar graphs display ICaL averaged current densities (current amplitude divided by the cell capacitance) expressed as the mean ± SEM (white for WT and gray for KI) with individual data shown on the columns. (C) ICaL current is decreased at –10 mV in Ca2+ unbuffered intracellular solution. Same conditions as in B, but without intracellular BAPTA, n = 16 WT and 11 KI cells. *P < 0.05 by t test.

