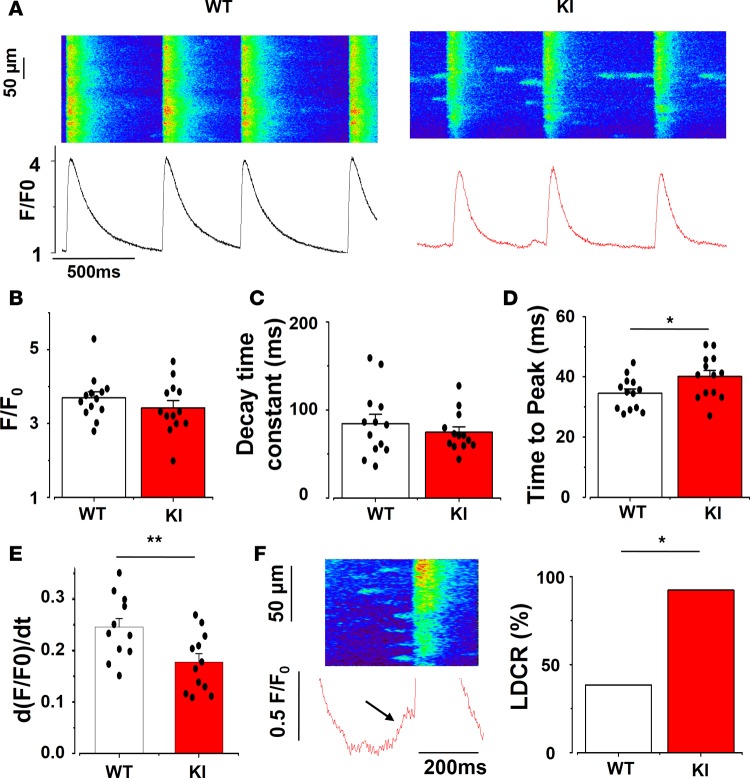
Figure 5. [Ca2+]i transient characteristics in SAN cells.
(A) Examples of line-scan confocal images showing [Ca2+]i transients (shown as peak, F/F0, where F is the fluorescence peak and F0 the fluorescence during the diastolic period) from WT (left) and KI (right) SAN cells. (B) [Ca2+]i transient amplitude is unchanged in KI SAN. (C) KI SAN cells have similar decay time constant (obtained by fitting the decay portion of the fluorescence trace to a single exponential). (D) Time to peak (duration between the beginning of the fluorescence [Ca2+]i transient and its peak) is longer in KI SAN. (E) The maximum value of the derivative of the fluorescence [Ca2+]i transient over time is smaller in KI cells, reflecting a slowing of the Ca2+ release. (F) Example of a ramp (late diastolic Ca2+ release, left), and the percentage of cells that present at least one ramp (right), which is higher in KI SAN cells (χ2). Ramp identification in the fluorescence trace is indicated by the black arrow. Bar graphs display mean value ± SEM of SAN cells with individual data shown on the columns, while each SAN value is averaged from at least 4 cells recorded in the same SAN. WT, white bars, n = 13 SAN cells; KI, red bars, n = 13 SAN cells. *P < 0.05, **P < 0.01.

