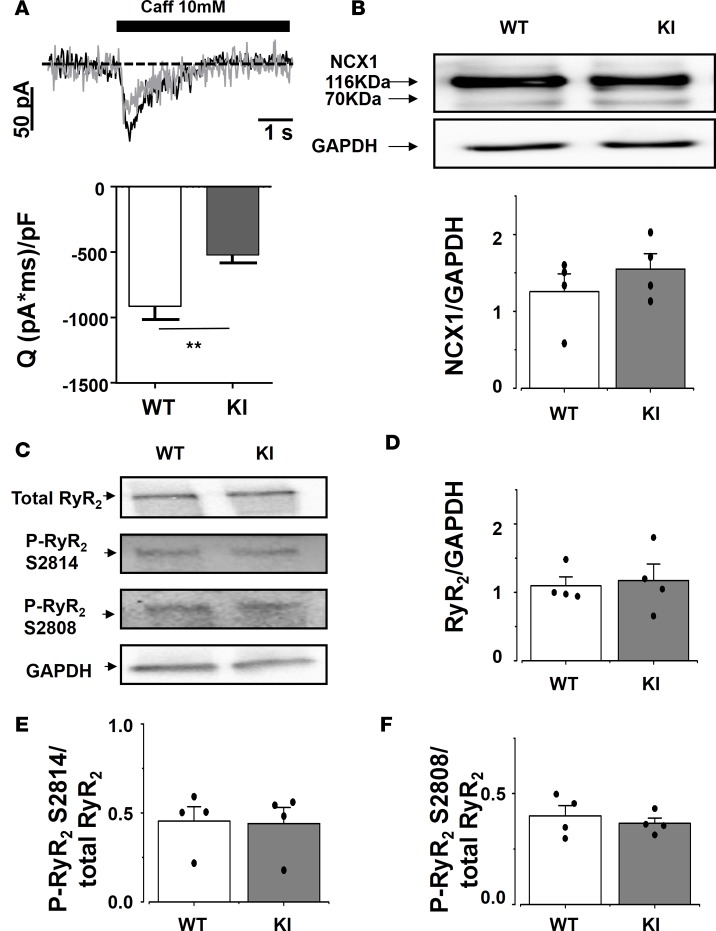
Figure 6. Caffeine-evoked inward current was significantly smaller in KI than in WT SAN cells, without changes in NCX1 or RyR2 protein expression, nor RyR2 phosphorylation level.
(A) Averaged transient inward current evoked by rapid caffeine application to 17 WT SAN cells and 16 KI cells, with example traces on top. (B) NCX expression in dissected SAN is unchanged between KI and WT. WT, n = 4 SAN cells, and KI, n = 4 SAN cells. (C) Examples of blots obtained for total or phosphorylated RyR2 and GAPDH. (D–F) Total RyR2 expression (C) and phosphorylated (S2814 [E] and S2808 [F]) RyR2 expressions are unaltered. n = 4 SAN cells each. White bars are for WT, and gray bars for KI, representing the mean ± SEM with individual data on the columns. **P < 0.01.

