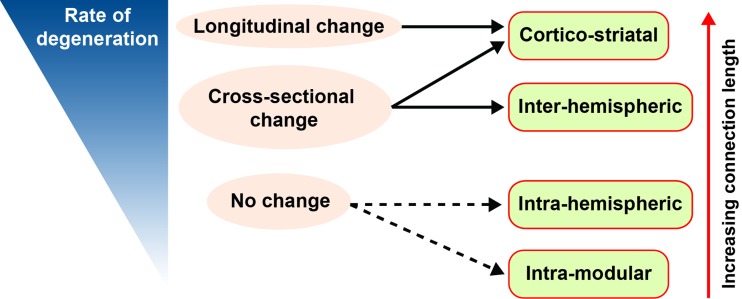
Figure 4. Schematic showing empirically determined hierarchy of white matter connection vulnerability in premanifest Huntington’s disease.
Connections with the largest shortest weighted path length have a higher rate of degeneration and show significant (q < 0.05) longitudinal change. Both cortico-striatal and interhemispheric connections showed significant (q < 0.05) cross-sectional change, while neither intrahemispheric or intramodular connections showed significant (q < 0.05) group differences. Red arrow indicates increasing path length with respect to connection type. Blue wedge indicates rate of degeneration: slow rate represented by thin wedge and fast rate represented by thick wedge. Full black arrow represents q < 0.05; dashed black arrow represents P < 0.05.

