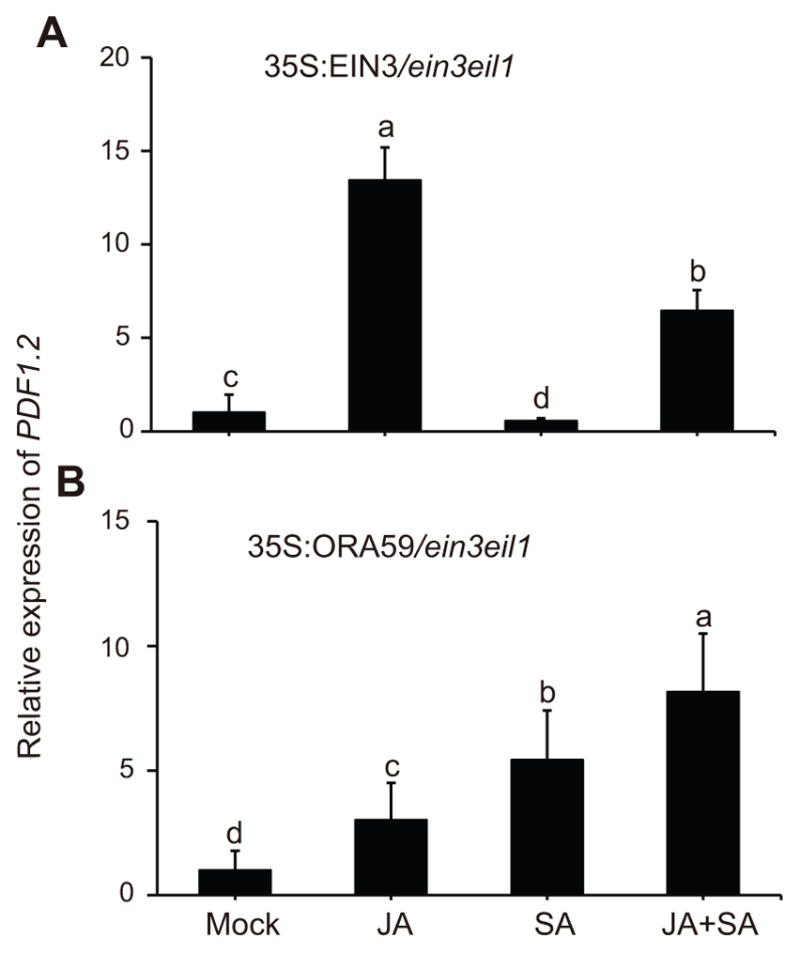
Figure 2. Overexpression of EIN3 reestablishes SA-mediated suppression of PDF1.2 in ein3 eil1.

Relative expression levels of PDF1.2 24 h post mock, JA, SA, and JA+SA treatments in ein3 eil1 loss of function mutant expressing 35S:EIN3 (A) and 35S:ORA59 (B). The transcript levels of PDF1.2 were normalized as described in the Figure 1. Data are mean ±SD of three independently soil grown biological replicates each with three technical repeats. Letters above bars indicate significant differences as determined by Tukey’s HSD method (p <0.05).
