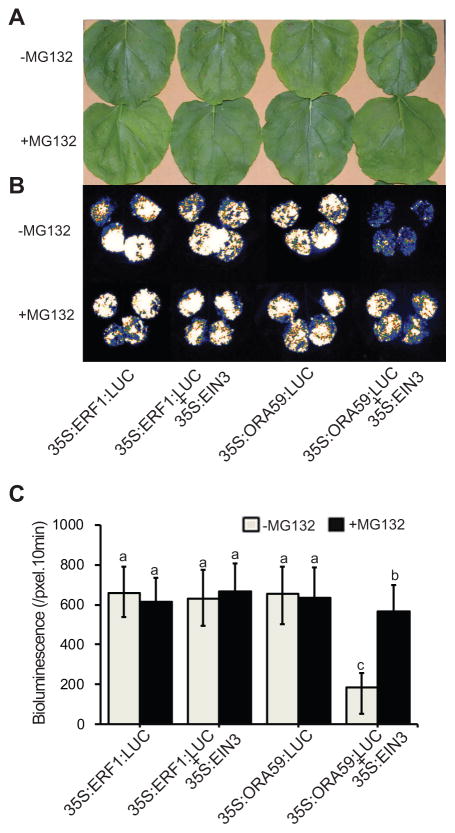
Figure 6. EIN3-dependent degradation of ORA59.
Representatives of transient expression assays in Nicotiana benthamiana displayed by bright- (A) and dark-field (B) of leaves expressing 35S:ERF1:LUC alone or together with 35S:EIN3, 35S:ORA59:LUC alone, or together with 35S:EIN3 in the presence or absence of 26S proteasome inhibitor MG132. (C) Intensity of LUC bioluminescence of the aforementioned leaves quantified using Andor Solis image analysis software. Data are mean ± SD (n = 20). Letters above bars indicate significant differences as determined by Tukey’s HSD method (p <0.05).

