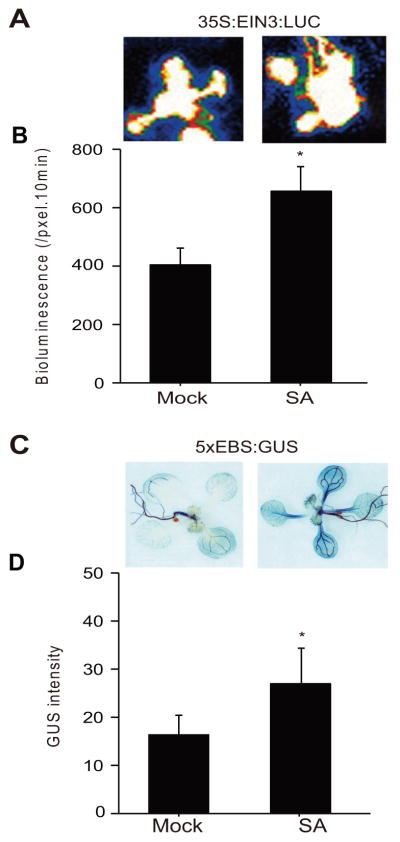
Figure 7. SA enhances EIN3 protein abundance and induces ethylene-responsive reporter.
(A) Representative images of seedlings expressing 35S:EIN3:LUC after 24 h of mock (control), and SA treatments. (B) EIN3 protein levels as a measure of LUC intensity using Andor Solis image analysis software. Data are mean ± SEM (n = 40). Asterisk above bars indicate significant differences as determined by Tukey’s HSD (p<0.05). (C) Representative images of seedlings expressing 5XEBS:GUS seedlings after 24 h of mock (control), and SA treatments. (D) Histograms display GUS intensity measurements. Data are mean ± SEM (n = 34). Asterisk above bars indicate significant differences as determined by Tukey’s HSD (p <0.05).

