. 2017 Jan 3;8(3):1831–1840. doi: 10.1039/c6sc05159f

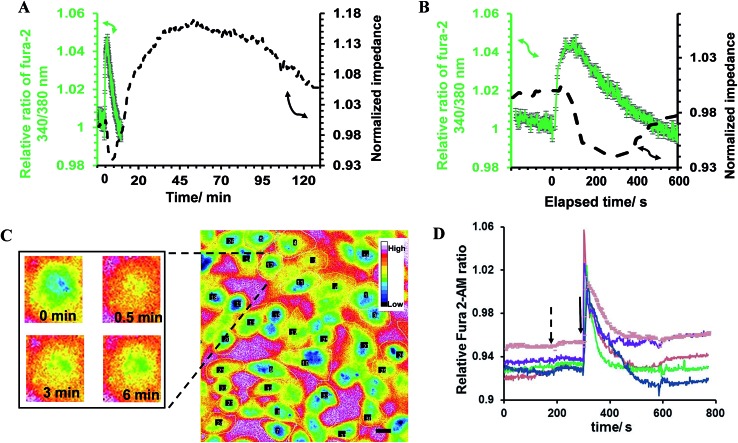
Fig. 2. (A) Relative average 100 μM histamine-induced change in the fura-2 ratio at 340/380 nm indicating the release of Ca2+ and the simultaneously recorded impedance of HeLa cells plated on a bare interdigitated ITO electrode. Cells were cultured on such surfaces until reaching an 80–98% confluent cell layer. The normalized impedance was calculated by dividing the impedance of the cell-covered electrode by the impedance of the cell-free one. (B) Expansion of the impedance and Ca2+ mobilization response for short time intervals from part (A) showing the correlation between the timescale of the fluorescence spike and the decline in the impedance below baseline levels. (C) Representative of an ensemble of fura 2-loaded HeLa cells plated on the surface. The time-resolved images of one of the cells are shown as an example. Images are pseudocoloured with warmer colours indicating a higher ratiometric fluorescence intensity in the cell regions. The respective elapsed time after histamine addition is shown in the images. (D) Each curve presents the change for one single cell. The ratiometric values of some cells in the field of view are shown in part (A) as examples of the data used to calculate the average change in the ratiometric value. All the fura-2 loaded cells were responsive to 100 μM histamine stimulation. The arrows indicate the time of Hanks' balanced salt solution (dashed arrow) or histamine (solid arrow) addition. Scale bar is 20 μm.

Fig. 2