. 2017 Jan 3;8(3):1831–1840. doi: 10.1039/c6sc05159f

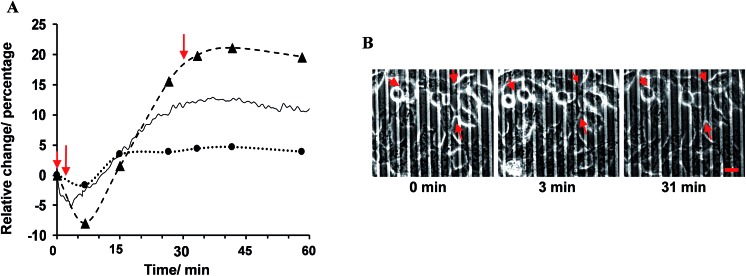
Fig. 3. (A) The experimental frequency-resolved impedance spectroscopy was fitted to the mathematical equation to estimate the contribution the changes in cell–cell connectivity (dashed line) and cell–substrate adhesion (dotted line) make in altering the overall impedance response. These data are shown along with the experimental impedance at 4 kHz (solid line). This frequency was detected to be the most sensitive frequency in revealing the impedance change in response to histamine addition in the examined range. (B) Representative time-lapse montages of HeLa cells before the addition of histamine, and at 3 min and 30 min after histamine stimulation, captured using phase-contrast microscopy performed simultaneously with impedance measurements, as shown in part (A). The arrows in part (A) indicate the times that the phase-contrast images were taken from the recorded video. The arrows on the images point to the locations with observable changes in the cell–cell distance. Scale bar is 20 μm.

Fig. 3