. 2017 Jan 3;8(3):1831–1840. doi: 10.1039/c6sc05159f

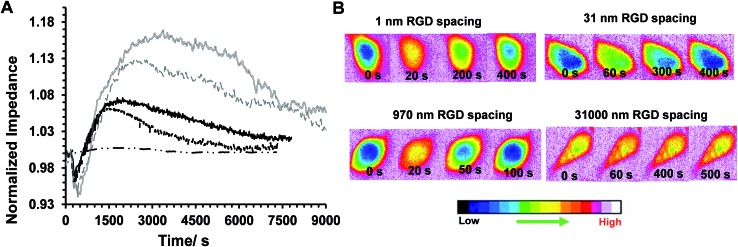
Fig. 6. (A) Some examples of simultaneously recorded real-time normalized histamine-induced impedance on surfaces with various RGD spacings of: 1 nm (black solid line), 31 nm (black dashed line), 970 nm (grey solid line) and 31 000 nm (grey dashed line), and the surface with no RGD (black dash-dotted line). (B) Some examples of simultaneously recorded time-lapse montages of fura-2-loaded single HeLa cells on surfaces with different average RGD spacings (the spacing is shown on top of each series of images). The elapsed time written on each image refers to the duration after histamine addition. The pseudocolour calibration bar indicates that warmer colours (e.g. orange, red) can be attributed to the regions with a higher concentration of intracellular calcium cells.

Fig. 6