. 2017 Jan 3;8(3):1831–1840. doi: 10.1039/c6sc05159f

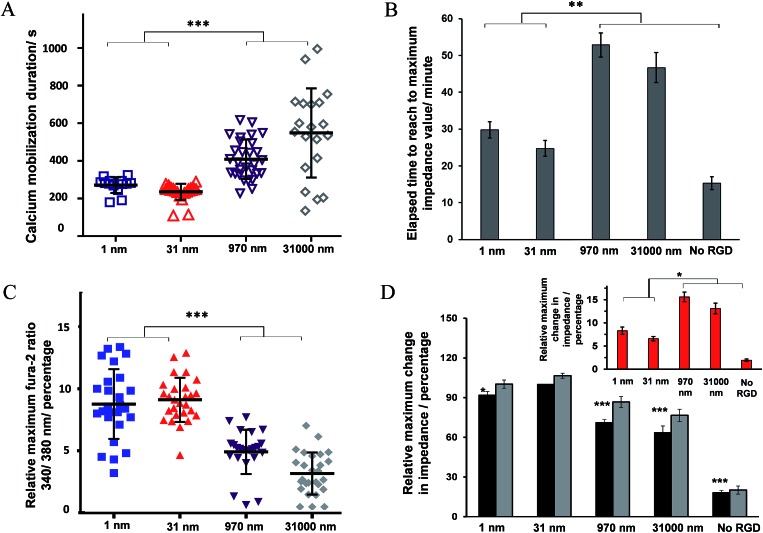
Fig. 7. (A) Ca2+ mobilization duration. (B) Time to reach the maximal impedance response. (C) The relative maximum normalized fura-2 ratiometric values. These data were obtained by dividing the fluorescence intensity measured with excitation at 340 nm by that measured at 380 nm for cells. The data were integrated over the ratiometric data of the individual cells in the ensemble of cells at the time of the maximum response divided by the respective ratiometric value of each cell before histamine addition, n ≥ 19. (D) Values of the maximum impedance response of cells before (black bars) and after (grey bars) histamine addition normalized to the impedance values of cell-free electrodes. The inset is the difference between the impedance values before and after histamine addition. The results quantitatively show the impact of presenting diverse average RGD spacings to cells on histamine-induced impedance changes and calcium ion release responses to the model drug. For statistics, 1 way ANOVA was run, comparing all the data sets with data of the surface with an average RGD spacing of 31 nm. *p < 0.05 relative to surfaces with 1 nm and 31 nm average RGD spacings, n ≥ 3.

Fig. 7