
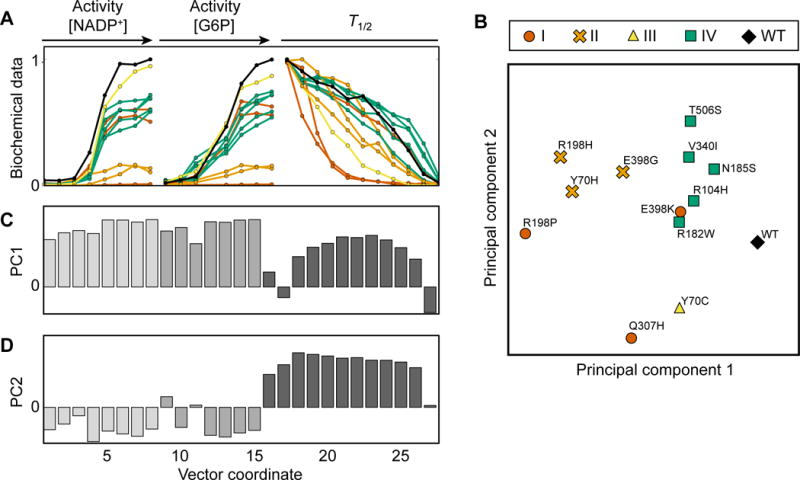
Figure 3. Principal component analysis (PCA) of biochemical data reveals biochemical separation between G6PD variant classes.
See also Table S3.
A) Representation of data vectors used for PCA. Normalized median curves of kinetic and biochemical measurements for each G6PD variant are shown in black (wild-type), red (class I), orange (class II), yellow (class III), or green (predicted class IV).
B) Biochemical characterization of 13 G6PD variants projected onto PC 1 and 2.
C,D) Values of principal components (PC) 1 (C) and 2 (D), which represent correlation and anticorrelation, respectively, between activity and stability.