
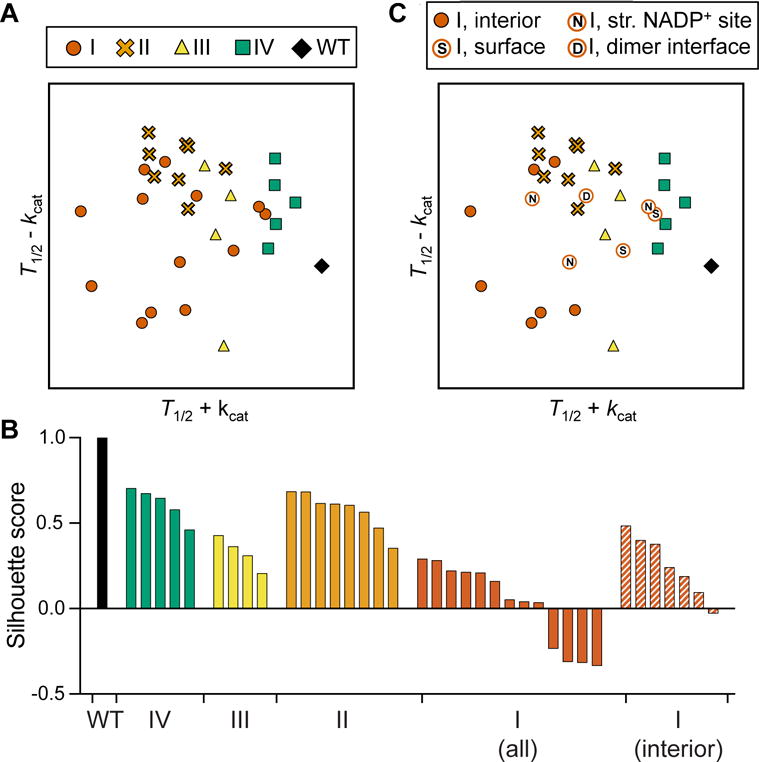
Figure 4. PCA-like visualization suggests additional functionality of some class I variants.
See also Table S4 and Fig. S2, S3.
A) Analysis of 13 G6PD variants from this study and 20 additional variants from previous studies, represented by normalized T1/2+kcat and T1/2−kcat.
B) Silhouette scores of each variant cluster from (A) (WT, IV, II, III, and I) and (C) (class I, excluding variants that are not in the protein interior). A silhouette score ranges from −1 to 1, with a higher score indicating that a point is matched well to its cluster and matched poorly to other clusters.
C) PCA-like plot with class I variants labeled corresponding to their structural location (S: surface, N: structural NADP+, D: dimer interface). Class I variants in solid red circles are located in the protein interior.