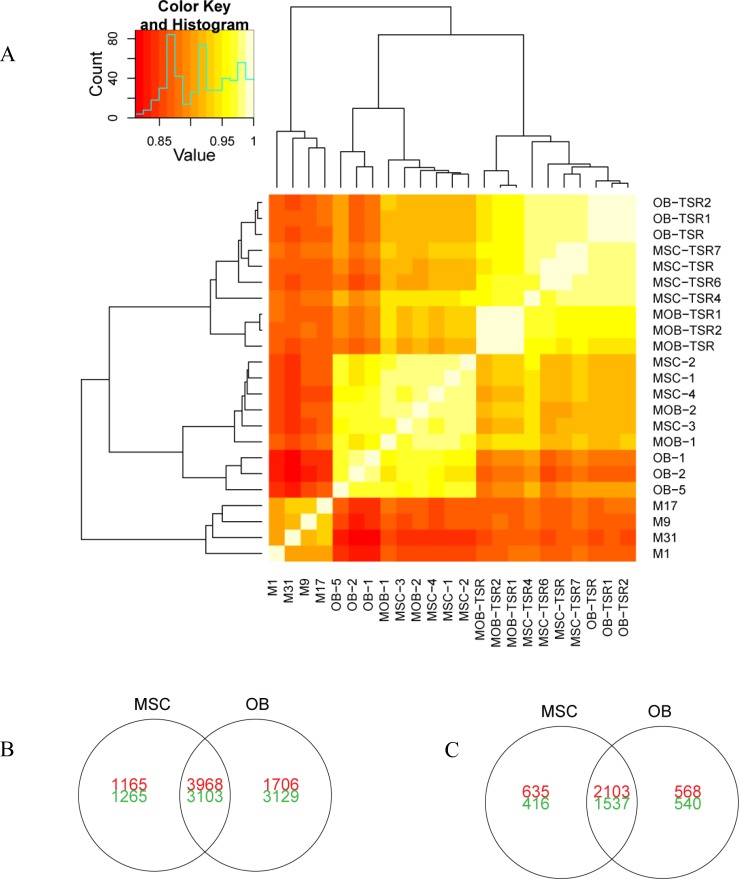
Figure 4. Gene expression differences between transformed cell lines, untransformed cell lines, and osteosarcoma xenografts.
(A) Unsupervised hierarchical clustering and heat map of gene expression correlation for untransformed cell lines, transformed cell lines, and osteosarcoma xenografts (M1, M9, M17, M31). Venn diagrams representing the number of genes differentially expressed (q-value <0.01) by transformed MSCs and pOBs as compared to (B) untransformed cell lines and (C) osteosarcoma xenografts. Red indicates increased expression and green indicates decreased expression.

