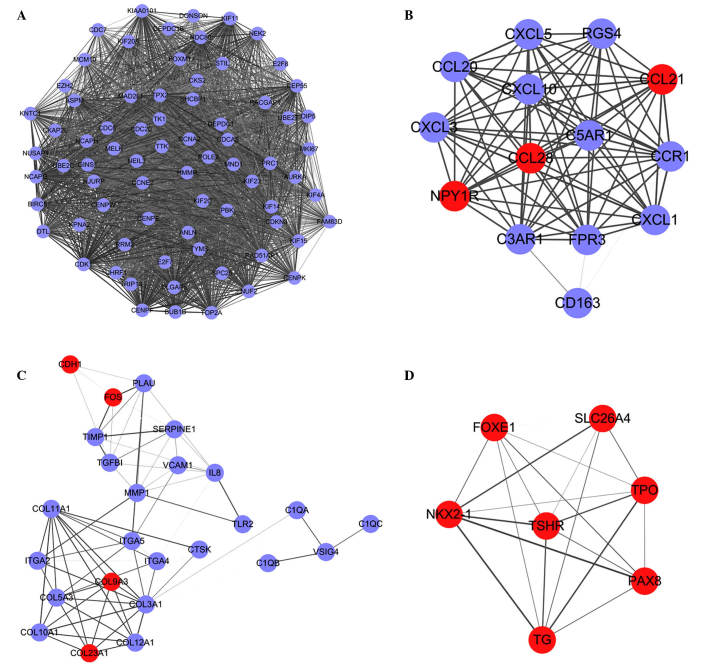
Figure 2.
Modules containing the top five node degrees in the protein-protein interaction network. Red indicates upregulated DEGs, purple indicates downregulated DEGs. Modules A-D are the four significant modules. DEGs, differentially expressed genes. Lines between DEGs represent interactions between them.

