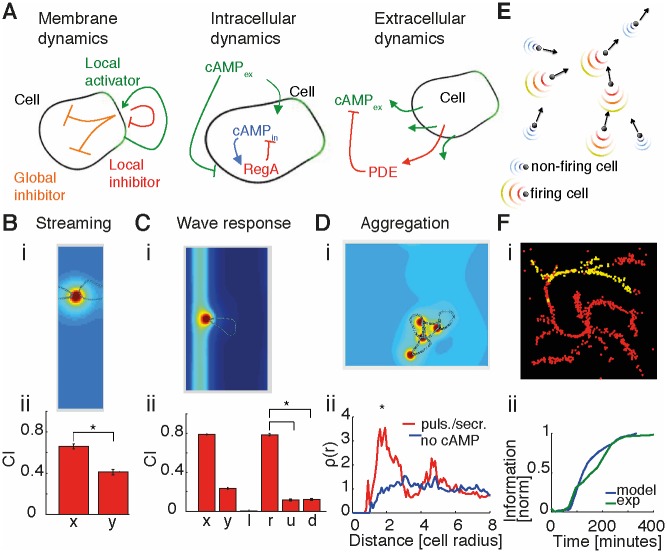
Fig 1. Multiscale model: From single cell—shape changes and chemotaxis to collective behavior.
(A) Schematics for membrane dynamics (left), intracellular cyclic adenosine monophosphate (cAMP) dynamics (center), and extracellular cAMP dynamics (right). (B) Single-cell “streaming" simulation in a box with periodic boundary conditions and a constant concentration of cAMP (i). Box dimensions are about 25 x 90 μm (the initial cell radius is assumed to be ∼15μm). Because of the small dimension of the box, the cell is just leaking, not pulsing, in order to avoid saturation of secreted cAMP. The simulation was repeated 12 times, and the average chemotactic index (CI) was calculated (ii). Error bars represent standard errors. Differences in CIx and CIy are statistically significant (p < 0.01), using a Kolmogorov—Smirnov test (KS test). (C) Cells solve “back-of-the-wave” problem. (i) A Gaussian wave (σ2 ∼ 60μm) moves from right to left with a speed of about 300 μm/min [40]. At the peak of the wave, the cell emits a pulse of cAMP. After the firing, the cell enters a refractory period during which it can neither fire again nor repolarize. The cell generally moves to the right and hence does not follow the passing wave. (ii) CI in x and y as well as in left (negative x), right (positive x), up (positive y), and down (negative y) directions in order to discriminate between the directions of the incoming (right direction) and outgoing (left direction) wave. Simulations are repeated 12 times; shown are averages and standard errors. Box is about 60 x 105μm. CI in the right direction is significantly higher than CI in the other directions. (D) “Aggregation simulation.” (i) Four cells are simulated moving in a constant concentration of cAMP. At the beginning, cells are randomly distributed. (ii) Density correlation at the end of simulations is plotted for control cells without secretion (blue) and all cells leaking cAMP and one cell also emitting pulses of cAMP (red). The red line has a significant (p < 0.05, KS test) peak at a distance of about two cell radii, representing cell—cell contact. Simulations in this case are also repeated 12 times. Box dimensions are 75 x 75 μm. See Materials and methods for details on density correlation, Supporting information for a full explanation of the detailed model, and S1 and S2 Data for data and code from simulations, respectively. (E) Schematic showing cells represented as point-like objects with velocity vectors. Firing cells emit pulses of cAMP, and nonfiring cells secrete cAMP at a low constant leakage rate. Spatial cAMP profiles are derived from detailed model simulations. At every time point, cells are allowed two possible directions of movement in order to reproduce pseudopod formation at the cell front, with directions changing by ±27.5° with respect to the previous movement, corresponding to an angle between pseudopods of about 55° [41]. (F) Screenshot during streaming for n = 1,000 simulated cells (i). Red (yellow) points represent nonfiring (firing) cells. (ii) Spatial information versus time: simulations (blue) compared with experimental dataset 3 (green). Values were then normalized and shifted in time to facilitate comparison; see S3 Data for the numerical values.

