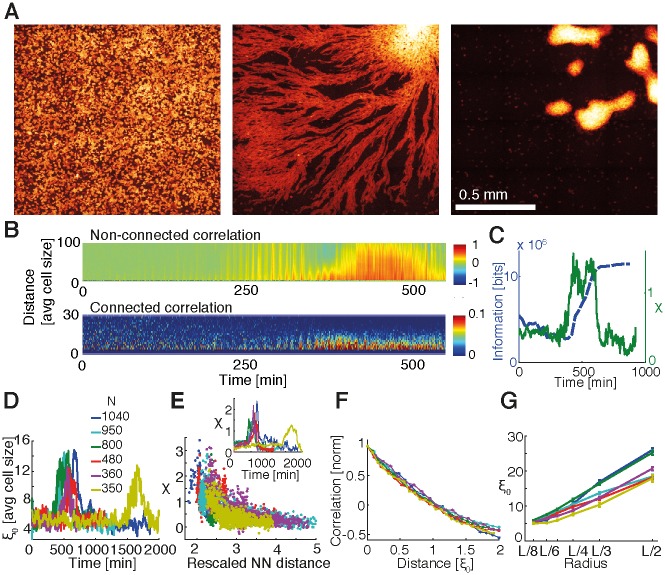
Fig 3. Collective behavior in experimental data for validating model.
(A) Cyan fluorescent protein (CFP) images of Dictyostelium aggregation of dataset 3. Images were taken after 4–5 h of starvation, when cells were still moving randomly, before initiating aggregation (left), during streaming phase (450 min after first image, center), and after aggregation (800 min, right). (B) Kymograph of nonconnected Cnc and connected Cc directional correlations for the movie in dataset 3. Distance r is expressed in units of average cell size (estimated after an ellipse was fitted to every cell contour and corresponding to the average of the minor axis, ∼10.7 μm). (C) Spatial information (blue) and susceptibility χ (green) of movie in dataset 3 as a function of time. The increase in spatial information denoting a more ordered image corresponds to the peak in susceptibility. (D) Correlation length ξ0 as a function of time for the six movies. Curves were smoothed with a moving average operation spanning 20 time points for better visualization. Inset: comparison of cell number estimated from TRED images during the streaming phase for different movies. (E) Susceptibility χ as a function of rescaled nearest-neighbor (NN) distance and as a function of time (inset). Note that the height of peaks increases and that the corresponding rescaled NN distance decreases with the number of cells, as it does for simulations. Rescaled NN distance was computed by normalizing NN distance by the average cell size. In order to decrease noise, profiles in the inset were smoothed with a moving average spanning 20 time points. (F) Normalized Cc as a function of correlation lengths ξ0 for different movies. Cc for every dataset was calculated as an average over 150 min of the streaming phase. Error bars represent standard errors. Similar to the simulated data, curves collapse for different numbers of cells when correlations are plotted as a function of distance in units of their respective correlation lengths. (G) Average correlation length versus neighborhood radius. L corresponds to the size of images (2,033 pixels,∼1.3 mm). ξ0 represents the average of 150 min during the streaming phase. Error bars represent standard errors. Cell positions and tracking for the different experimental data are provided in S6–S11 Data, with actual data provided in S12 Data. Numerical results for the correlation analysis for panels D–F are provided in S13 Data and for panel G in S14 Data.

