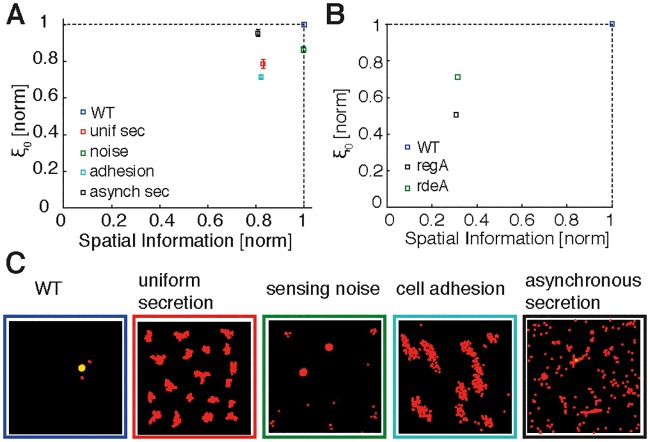
Fig 4. Role of criticality in aggregation of wild-type and mutant cells.
(A) Correlation length (during streaming) and spatial information (of final aggregate) for coarse-grained simulations of n = 500 cells for wild-type (WT) and modified cell types. Correlation length and spatial information are normalized with respect to WT (blue symbol). Modified-cell simulations were performed with uniform (radially symmetric) secretion of cyclic adenosine monophosphate (cAMP) (red), significantly increased sensing noise (10-fold increase in standard deviation compared to WT noise; green), enhanced cell—cell adhesion (light blue), and asynchronized secretion (random pulsing; black). (B) Corresponding correlation length and spatial information for experimental data from Fig 5 of [55], considering WT cells (blue) and protein kinase A (PKA) pathway mutants (with the asynchronous regA mutant in black and the phosphorelay intermediate protein [rdeA] mutant in green). (C) Screenshots show cell distributions at the end of the simulations from (A). Error bars represent standard errors in correlation length for an average in time of 50 min during the streaming stage. See Supporting information for a detailed explanation and S15 and S16 Data for numerical values for simulations and experimental data, respectively.

