
Fig 7.
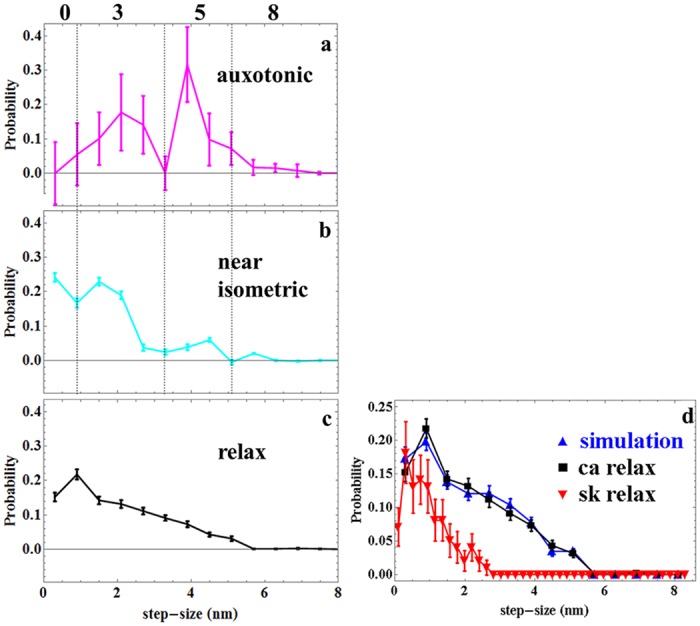
Panels a-c. In vivo cardiac myosin active cycle from auxotonic (force developing), through near-isometric (maximum force), to detachment (relaxation) phases. Error bars indicate standard deviation of the mean for 15 or 24 cardiac muscle fibers from 8 or 6 embryos and corresponding to 1251 or 1436 single photoactivated myosin coordinates from relaxed and active hearts, respectively. Dotted vertical lines in panels a & b define the boundaries between step-size frequencies computed from areas under the curves for nominal steps of 0, 3, 5, and 8 nm (nominal step-size corresponds to the in vivo measured step-sizes of 0, 2, 4, and 6 nm as indicated on the x-axis legend). Areas at step-size boundaries are split equally between adjoining step-sizes. Panel d. Simulated (blue) and observed (black and same as in panel c) relaxed cardiac (ca) myosin step-size distribution. Simulation is based on dispersion of thick filament structure surmised from the atomic model of Alamo et al. [27] as described in METHODS. In vivo relaxed skeletal (sk) myosin step-size from zebrafish embryo trunk muscle (red) is shown for comparison [31].