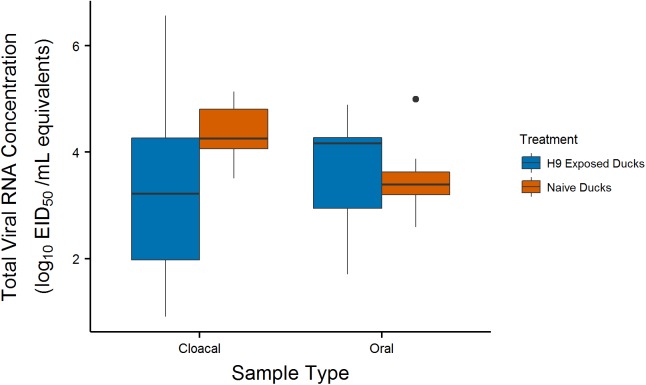
Fig 2. Heterosubtypic Immunity.
Box plots summarize the distribution of total viral shedding in oral/cloacal swabs taken from the H9-exposed control group and naïve ducks from another study [22]. Boxes show the interquartile range (IQR, middle 50% of values) for each group, horizontal lines represent medians, and vertical lines are values within 1.5*IQR. Outliers are plotted as individual points.

