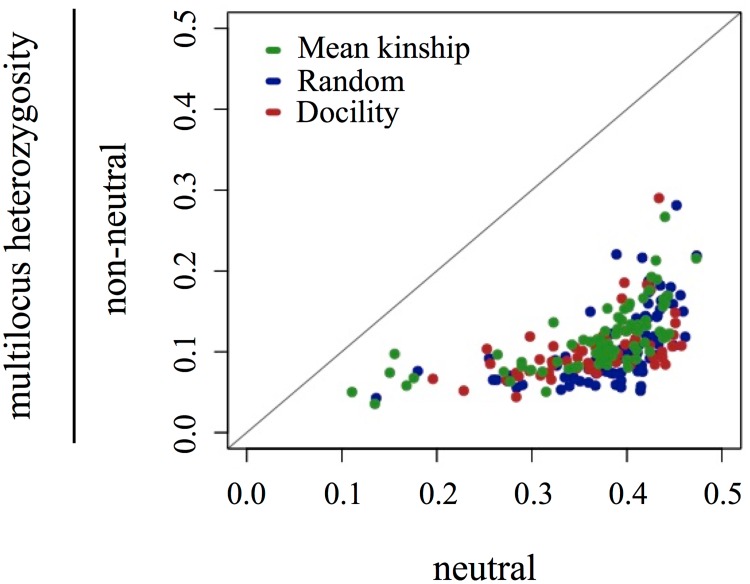
Fig 3. Within-individual estimates of multilocus heterozygosity (MLH) calculated using neutral as well as nonneutral SNPs.
Diagonal line illustrates location of perfect concordance between neutral SNPs and non-neutral SNPs; individuals with equal MLH in neutral and nonneutral SNPs would be plotted on the diagonal. Overall, nonneutral SNPs have less diversity (lower MLH) compared to estimates calculated from neutral SNPs.

