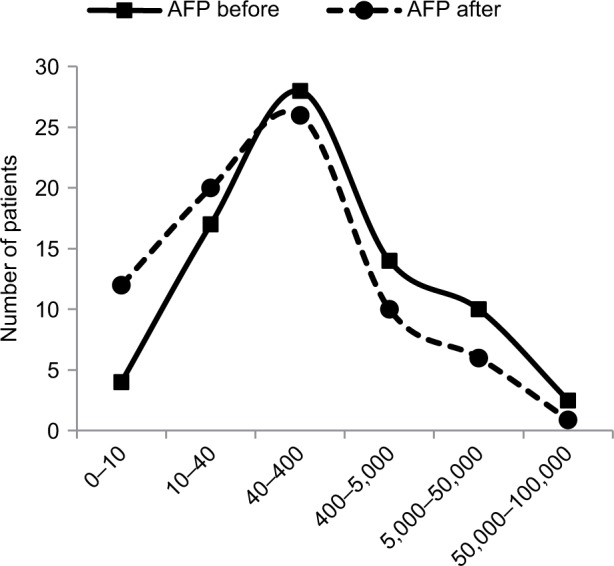
Figure 4.

Increase in proportion of patients having lower levels of AFP after a median of 2 months, as shown in their absolute number plotted against Y-axis in relation to pre-set range of AFP plasma concentrations (shown on horizontal axis) into which they fall before (solid line) and after (dotted line) immunotherapy. Baseline median AFP level was 245.2 IU/mL (mean 4,233; range 7.2–92,407; 95% CI 1,186–7,280) and post-treatment value was 102.3 IU/mL (mean 2,539; range 0.9–54,478; 95% CI 503–4,575). There is a clear shift to the left toward lower concentrations of post-treatment AFP values compared to baseline distribution curve, which was statistically significant (R2=0.76; P=0.02).
Abbreviations: AFP, alpha-fetoprotein; CI, confidence interval.
