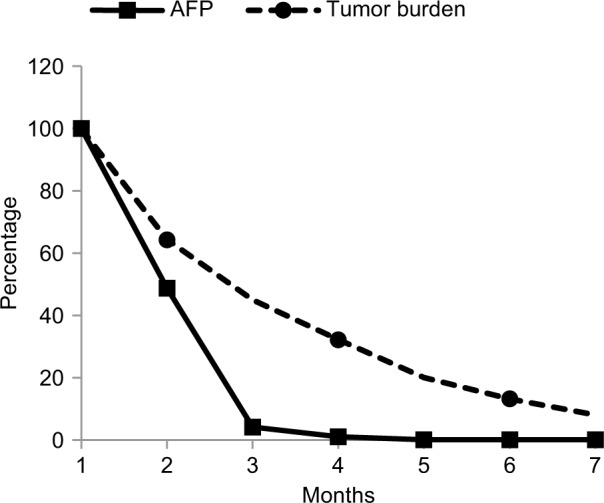
Figure 5.

Plots expressed as percent (Y-axis) of baseline monthly values of AFP and bimonthly tumor size measurements by CT scan in patient #24 who had them evaluated for 7 months (X-axis). Changes in tumor burden were estimated by summing up perpendicular diameters of each lesion. AFP level in this patient was measured in ng/mL instead of usual units expressed in IU/mL. These values were converted into percentage figures relative to baseline values shown as 100% on Y-axis against X-axis showing number of months on follow-up. Linear regression analysis based on observed values shows strong dependency between these variables (R2=0.96; P=0.02) indicating that this relationship is unlikely to be random meaning that decrease in AFP was positively correlated with tumor burden reduction.
Abbreviations: AFP, alpha-fetoprotein; CT, computed tomography.
