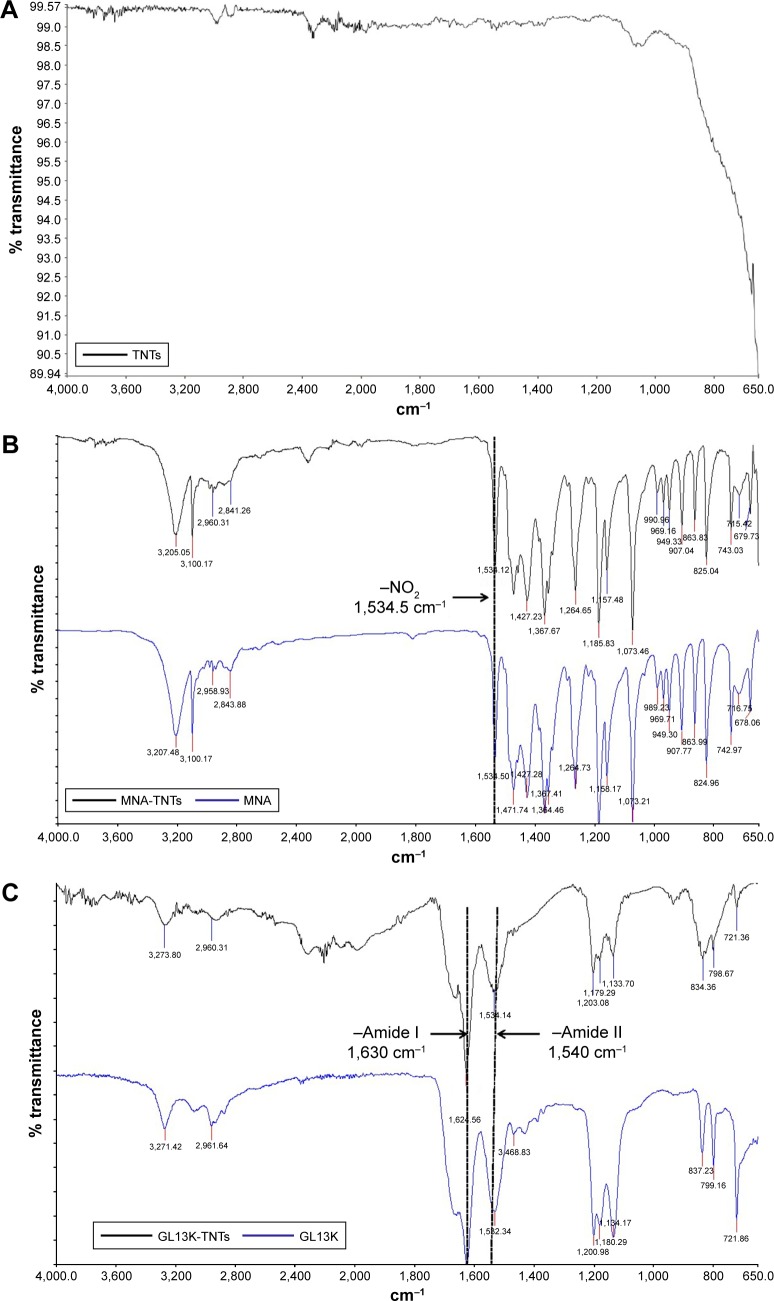
Figure 3.
FTIR spectra of (A) TNTs with no absorption wave; (B) MNA-TNTs with a wave number at 1,534.5 cm−1 attributed to the −NO2 peak from MNA; (C) GL13K-TNTs with amide peaks at 1,630 and 1,540 cm−1 from GL13K.
Abbreviations: FTIR, Fourier transform infrared spectroscopy; MNA, metronidazole; MNA-TNTs, MNA-immobilized TNTs; TNTs, TiO2 nanotubes.

