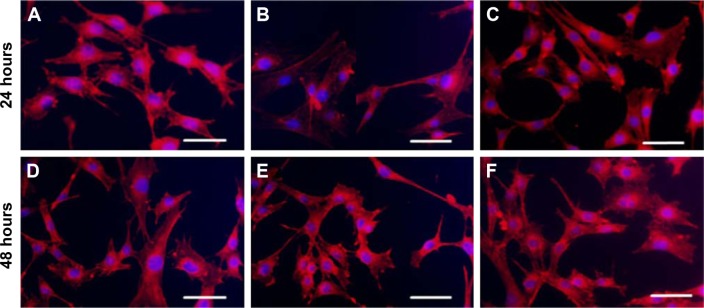
Figure 8.
Fluorochrome micrography of MC3T3-E1 cells cultured for 24 and 48 h on (A, D) TNTs, (B, E) MNA-TNTs, and (C, F) GL13K-TNTs (magnification =×320; scale bar =100 µm). Actin is shown in red and cell nuclei are shown in blue. On MNA-TNTs, some cells spread poorly with less polygonal and elongated cell shapes.
Abbreviations: MNA, metronidazole; MNA-TNTs, MNA-immobilized TNTs; TNTs, TiO2 nanotubes.

