Figure 11.

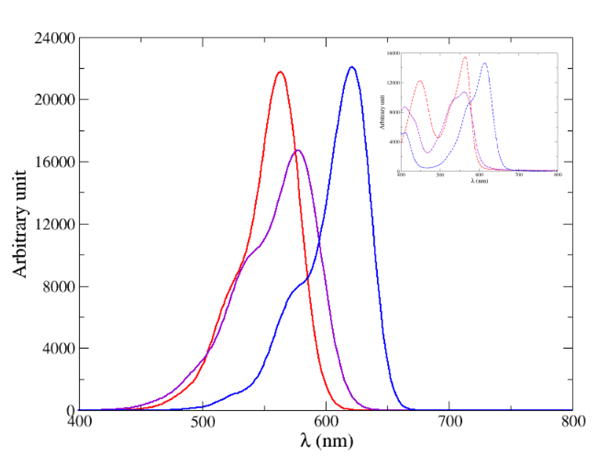
Computed vibronic absorption spectrum of 1 (red), 2 (purple) and 3 (blue). For their convolution, a HWHM of 0.06 eV was employed for 1 and 2 while a HWHM of 0.04 eV was set for 3. The inset represents the experimental data.

Computed vibronic absorption spectrum of 1 (red), 2 (purple) and 3 (blue). For their convolution, a HWHM of 0.06 eV was employed for 1 and 2 while a HWHM of 0.04 eV was set for 3. The inset represents the experimental data.