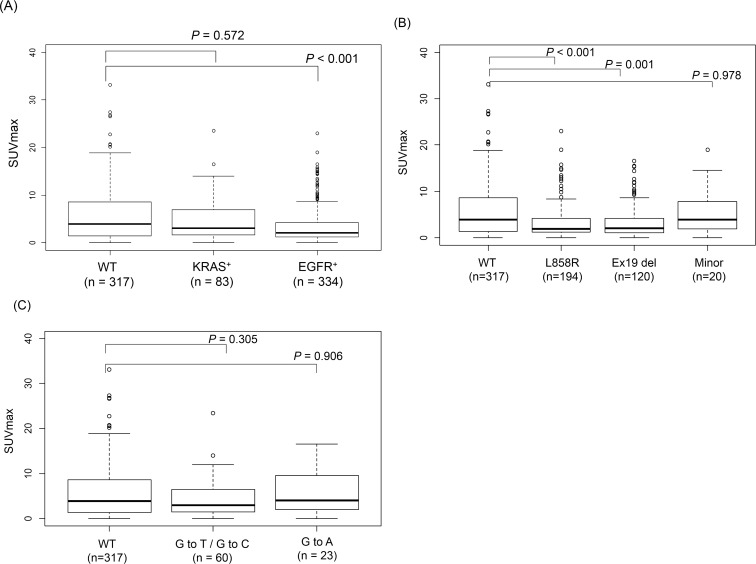
Fig 1. Correlations between SUVmax of primary tumors and EGFR and KRAS mutation status.
(A) Box plot of SUVmax of primary tumors according to EGFR and KRAS mutation status, (B) Box plot of SUVmax of primary tumors according to EGFR mutation spectra, (C) Box plot of SUVmax of primary tumors according to KRAS mutation spectra.

