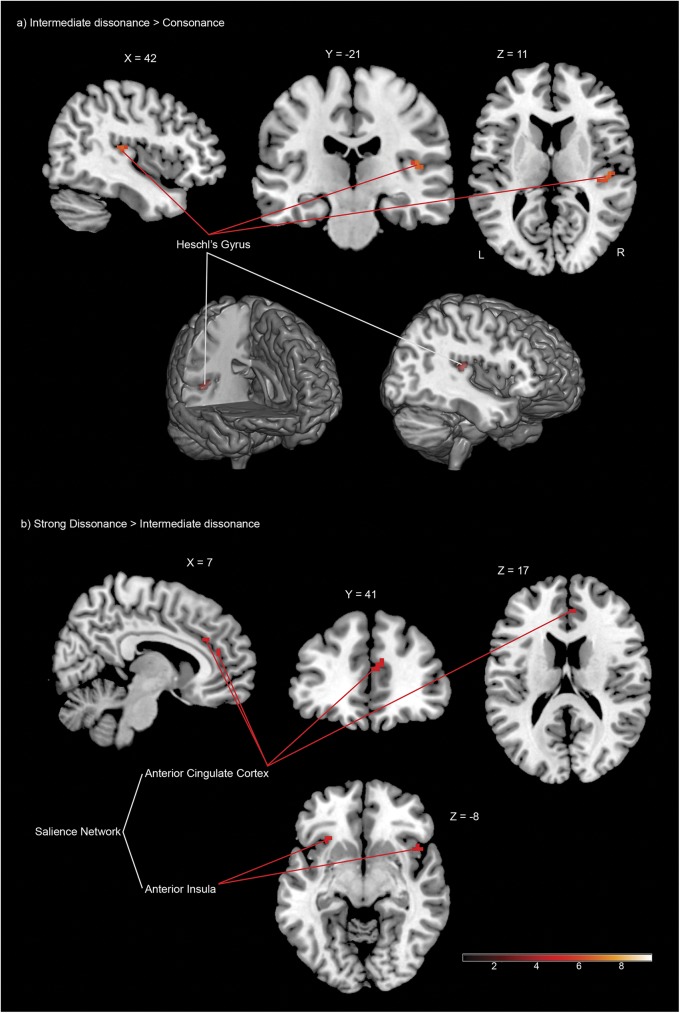
Fig 3. FMRI results (FWE-corrected P < 0.05 for cluster-level inference) [High resolution image].
Coloured areas (red) reflect: (a) Statistical parametric maps (SPM) showing voxels in the right Heschl’s gyrus in which the response was higher during the evaluation of intermediate dissonant sounds compared to consonant sounds, superimposed onto a standard brain in stereotactic MNI space (from left to right: sagittal, coronal and axial views; 3D render view below). (b) Statistical parametric maps showing voxels in right anterior cingulate cortex and bilateral anterior insula in which the response was higher during the evaluation of strong dissonant sounds compared to intermediate dissonant sounds.

