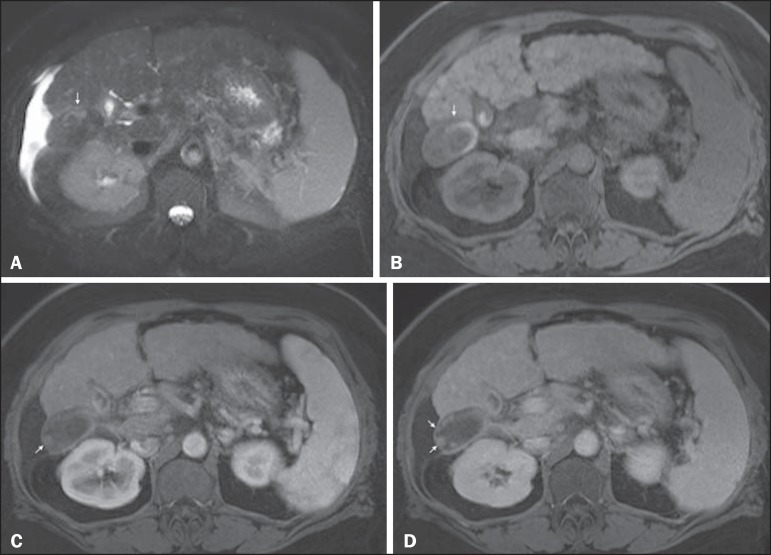
Figure 11.
Recurrence of HCC treated by radiofrequency ablation. Axial fat-suppressed SS-FSE T2-WI (A), axial pre- (B) and post-contrast fat-suppressed 3D-GRE T1-WI in the arterial (C) and interstitial (D) phases. A treated area is seen at the right lobe (arrow, A,B), showing iso-signal intensity on T2-WI (A) and a partial/ interrupted rim of high-signal intensity on pre-contrast T1-WI (B). On the dynamic postcontrast images, progressive peripheral nodular enhancement is evident (arrows, C,D). These features are consistent with recurrence of disease.

