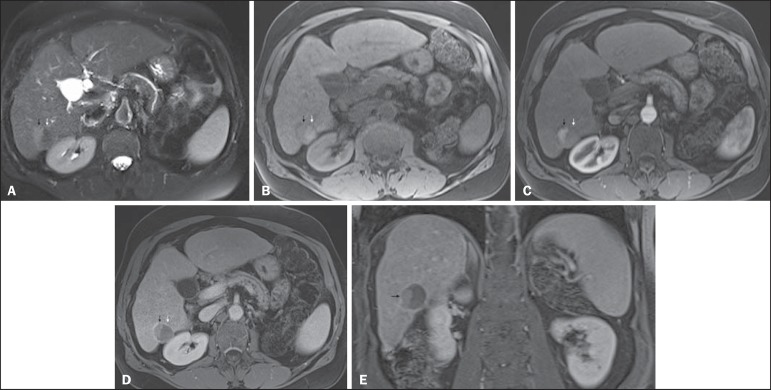
Figure 12.
Recurrence of HCC after chemoembolization. Axial fat-suppressed SS-FSE T2-WI (A), axial pre- (B) and postcontrast fat-suppressed 3D-GRE T1-WI in the arterial (C) and interstitial (D) phases, and coronal postcontrast fat-suppressed 3D-GRE T1-WI in the interstitial phase (E). A treated area post-TACE is seen in the right liver lobe (arrows, A–E), showing heterogeneous intensity on T2-WI, with areas of moderate high-signal (black arrow, A) and low-signal (white arrow, A) intensity. These same areas show low-signal (black arrow, B) and high-signal (white arrow, B) intensity on precontrast T1-WI, respectively. On the dynamic postcontrast images, the areas of high-signal T2-WI are hypervascular (black arrow, C) and show washout and pseudocapsule on interstitial phase (black arrow, D,E), consistent with residual/recurrent HCC. The medial aspect showed no signs of recurrence.

