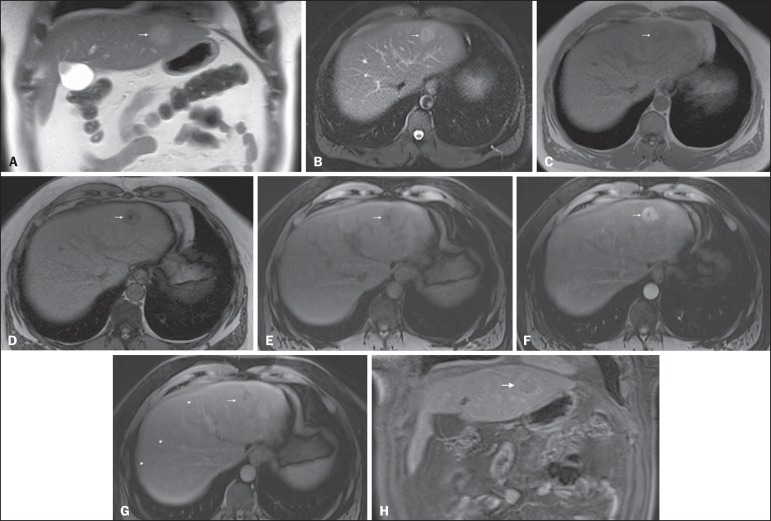
Figure 2.
Fatty HCC in a patient with non-alcoholic fatty liver disease. Coronal SS-FSE T2-WI (A), axial fat-suppressed FSE T2-WI (B), axial in- (C) and out-of-phase (D) GRE T1-WI, axial pre- (E) and postcontrast fat-suppressed 3D-GRE T1-WI in the arterial (F) and interstitial (G) phases, and coronal fat-suppressed 3D-GRE T1-WI in the interstitial phase (H). One nodule is depicted on the left hepatic lobe (arrows, A–G), showing mild high signal intensity on T2-WI (A,B), low-signal intensity on in-phase T1-WI (C), and heterogeneous drop of signal on out-of-phase T1-WI (D). On the dynamic postcontrast images, the nodule is hypervascular (F) and shows delayed washout and pseudocapsule enhancement (G,H). Note the fine fibrotic bands of the liver parenchyma, which are seen at the late interstitial phase (arrowheads, G).

