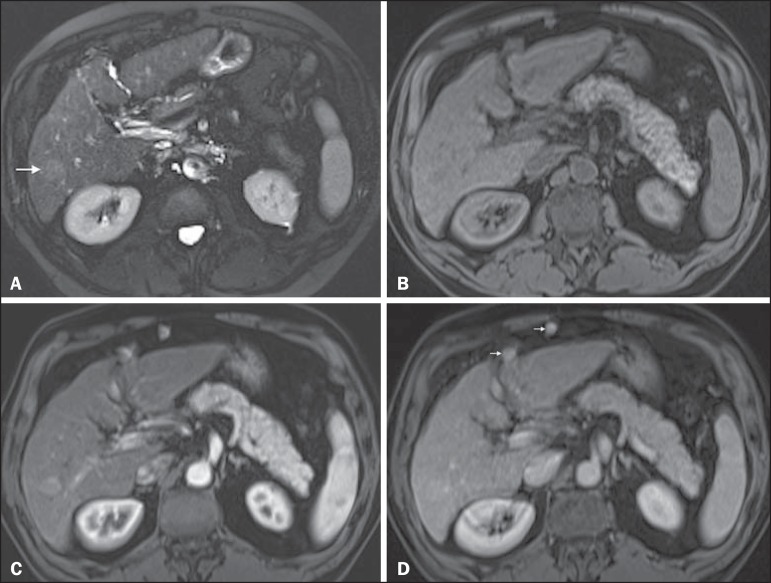
Figure 3.
HCC in a patient with chronic alcoholic liver disease. Axial fat-suppressed SS-FSE T2-WI (A), axial pre- (B) and postcontrast fat-suppressed 3D-GRE T1-WI in the arterial (C) and interstitial (D) phases. There is a 2-cm lesion in the right hepatic lobe, showing mild high signal intensity on T2-WI (arrow, A), low signal on T1-WI, arterial hyper-enhancement with no washout on the delayed phase. Despite this lesion cannot be categorized as HCC by imaging criteria, the combination of mild high T2 signal intensity and hypervascular characteristics are very likely related to HCC in the setting of liver cirrhosis. Note the recanalization of the umbilical vein (arrows, D).

