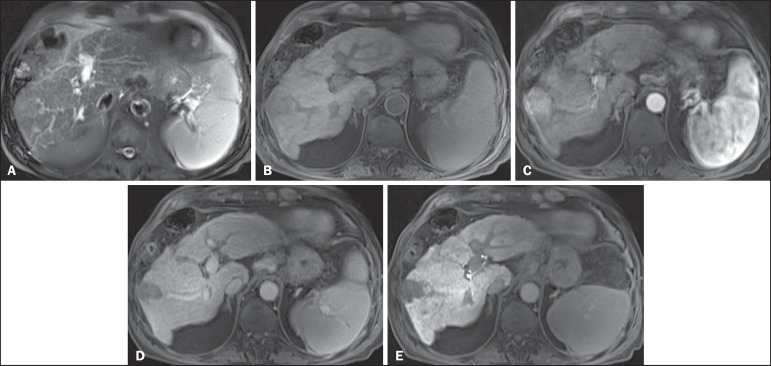
Figure 5.
HCC evaluated using gadoxetate disodium (hepatobiliary contrast agent). Axial fat-suppressed (A) SS-FSE T2-WI, axial pre- (B) and postgadolinium (gadoxetate disodium) fat-suppressed 3D-GRE T1-WI in the arterial (C), interstitial (D) and hepatobiliary phases (E). An HCC is depicted in the right liver lobe, in a background cirrhotic parenchyma, showing mild high signal intensity on T2-WI, low signal intensity on T1-WI, hypervascular characteristics (C) and washout on the delayed phase (D). On the hepatobiliary phase, due to the presence of impaired hepatocytes, the HCC shows no enhancement (E). Note the enhancement of the biliary duct (arrowheads, E).

