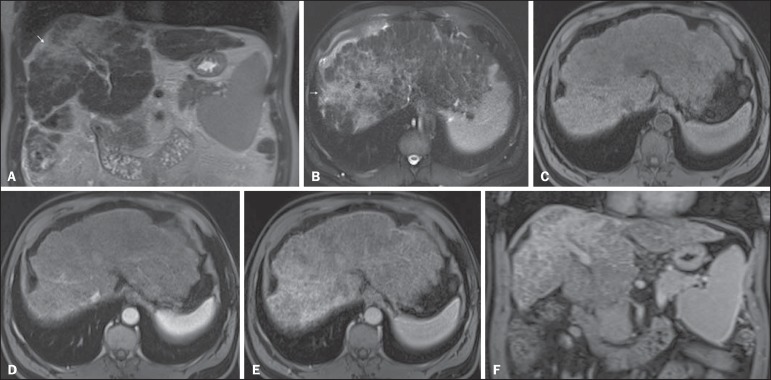
Figure 8.
Liver cirrhosis with confluent fibrosis. Coronal (A) and axial fat-suppressed (B) SS-FSE T2-WI, axial pre- (C) and postcontrast fat-suppressed 3D-GRE T1-WI in the arterial (D) and interstitial (E) phases, and coronal postcontrast fat-suppressed 3D-GRE T1-WI in the interstitial phase (F). There is a linear pattern of fibrosis throughout the liver, with a focal region of confluent fibrosis in segments 7 and 8 peripherally (arrow, A,B), that is moderately high in signal on T2-WI (A,B) and mildly low in signal on T1-weighted image (C) and demonstrates negligible enhancement on early postcontrast image (D) and moderate enhancement on delayed image (E,F). The fine pattern of fibrosis is better depicted on late postgadolinium images as linear enhancing structures (E,F). Note the distorted anatomy and capsular retraction of segment 7, in relation to the more prominent region of fibrosis. The absence of portal vein thrombus, lack of arterial hyper-enhancement and delayed progressive enhancement allows the confident diagnosis of confluent fibrosis and excludes diffuse HCC.

