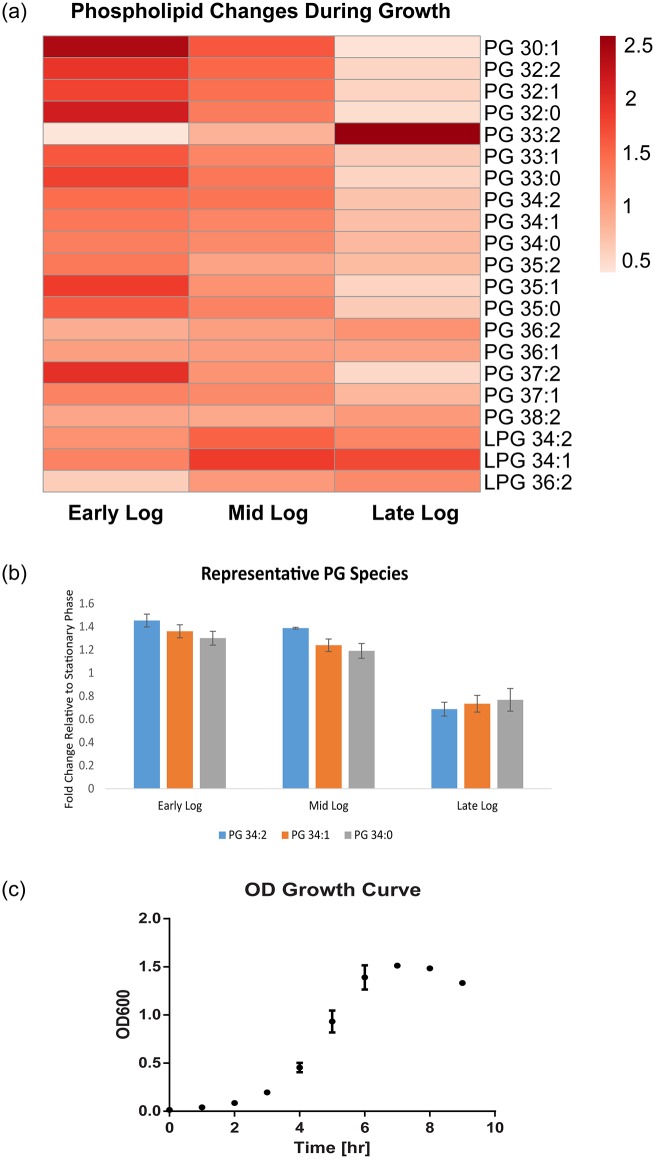
Fig 3. The levels of E. faecalis strain OG1RF PG and LPG can be tracked throughout the growth curve.
(A) Heat map depicting phosphatidylglycerol (PG) and lysyl-PG levels in the early-, middle- and late-logarithmic growth phases relative to the late stationary phase. The colour scale (top right) indicates fold change of phospholipids (PG and lysyl-PG) in early-, mid-, and late-logarithmic phase cells with respect to late stationary phase cells. (B) Bar chart showing representative fold change values for PG 34:0, 34:1 and 34:2. (C) The three logarithmic phases corresponded to optical density (OD) values of 0.3, 0.5 and 0.8 on an OD growth curve.

