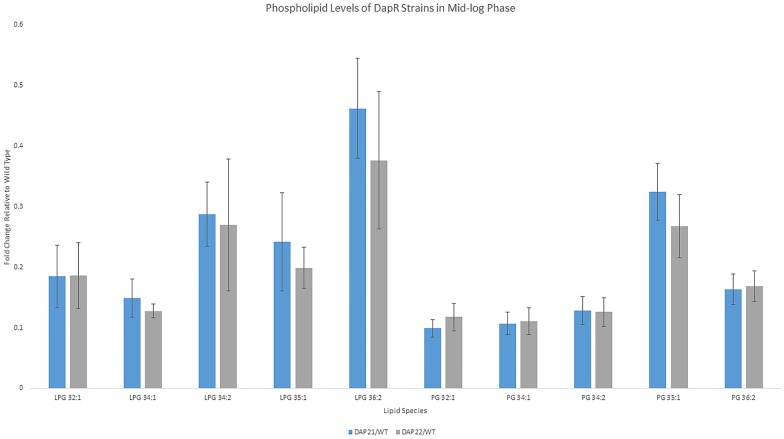
Fig 4. The levels of PG and LPG in two daptomycin-resistant strains, Dap21 to Dap22, compared to non-resistant OG1RF.
The bar chart shows the fold change of 5 LPGs and their corresponding PGs from Dap21 and Dap22 grown to mid-logarithmic phase, with respect to the non-resistant OG1RF parental strain. Data are expressed as mean ± standard deviation (SD) (calculated from 5 replicates) with the SDs represented as error bars.

