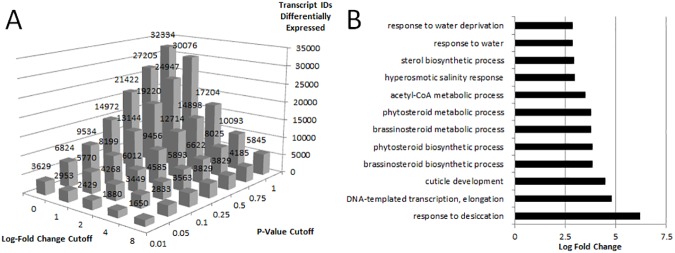
Fig 1. Number of differentially expressed genes identified by RNAseq analysis.
A) the number of transcripts differentially expressed in RNAlater compared to liquid N2 shown by log-fold change (base two) and p-value cutoffs and B) the log fold enrichment of the GO terms for biological processes enriched for the 5770 transcript IDs differentially expressed at log-fold change ±1 (p ≤ 0.05). All reported GO terms are significant at a p-value of 0.05 or below.

