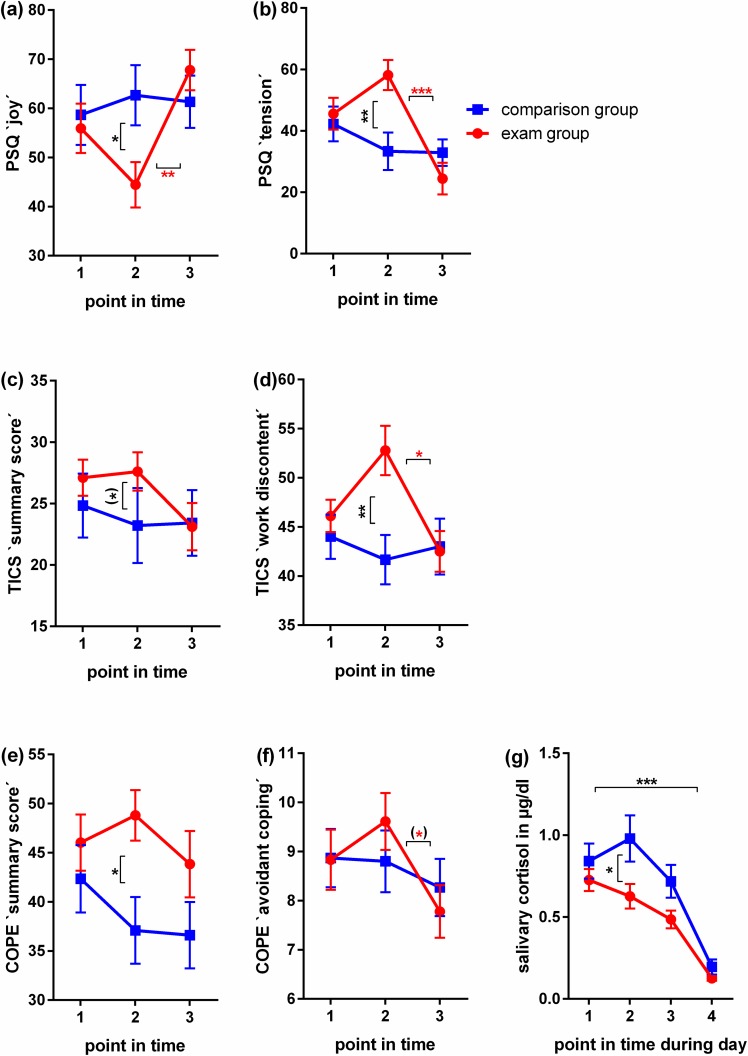
Fig 2. Self report assessment of stress perception and emotional strain in female medical students during their final exam.
Graphs (a)-(f) show self-report data assessed at the following points in time (T): baseline, twelve weeks prior to the exam and before the learning period started (1); within the first and second week after the written part of the exam and before test results were released (2); and twelve weeks after the completion of the exam (3). Graph (g) shows cortisol measurements in saliva samples taken on the day prior to T2. Samples were processed to assess diurnal cortisol secretion as described below in the Materials and Methods section. (a)-(g): N = 18 in exam group, N = 15 in comparison group. Mean values and SEM are shown. Mann Whitney U tests were used to examine differences between group means at distinct points in time, Kruskal-Wallis tests with post-hoc Dunn's tests corrected for multiple comparisons to examine differences between different points in time within one group. P-values < 0.1 –one asterix in brackets, <0.05 –one asterix, < 0.01—two asterix, < 0.001—three asterix.

