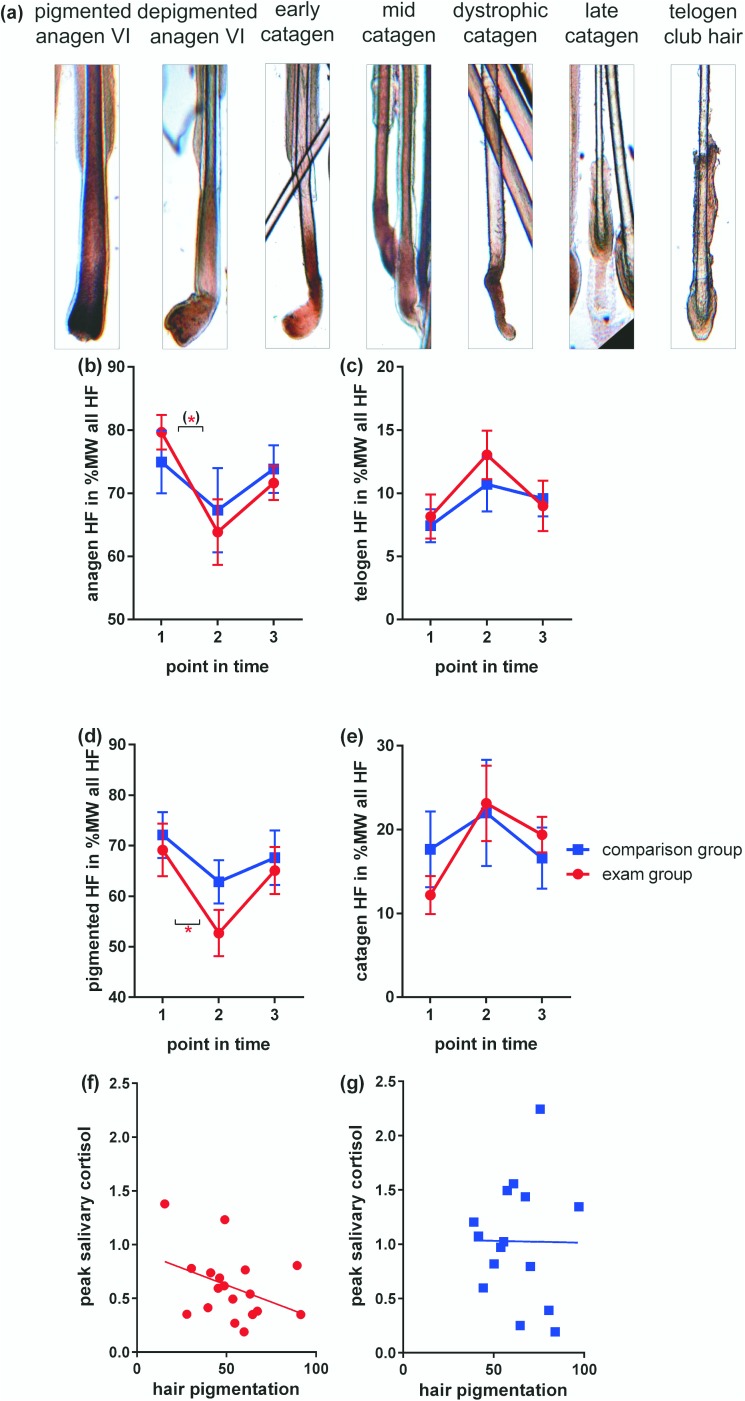
Fig 4. Assessment of hair cycle progression and pigmentation in female medical students during their final exam.
(a): representative photomicrographs illustrate morphology of HF in the respective hair cycle and pigmentation state. (b)-(e): N = 18 in exam group, N = 15 in comparison group. Mann Whitney U tests were used to examine differences between group means at distinct points in time, Kruskal-Wallis tests with post-hoc Dunn's tests corrected for multiple comparisons to examine differences between different points in time within one group. Mean values and SEM are shown. P-values < 0.1 –one asterix in brackets, <0.05 –one asterix. Note that some seasonal fluctuations can be observed in the comparison group students. (f) and (g) Pearson correlation of hair pigmentation at T2 with peak salivary cortisol level (point in time 2) shown in Fig 2 in exam group participants (f) and comparison group participants (g).

