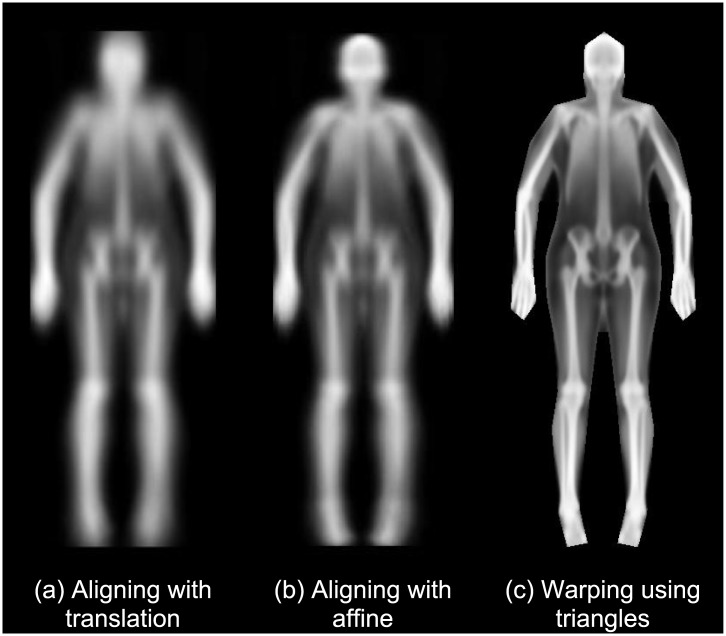
Fig 2. Mean images created with the 200 R-value images.
Images were calculated using alignment with (a) translation, (b) translation, rotation, and scaling (affine), and (c) piecewise warping using the triangle model in Fig 1. Each successive mean image is visually sharper than the last, indicating that the more advanced alignment techniques are more effective at eliminating noise from shape and pose variation.

