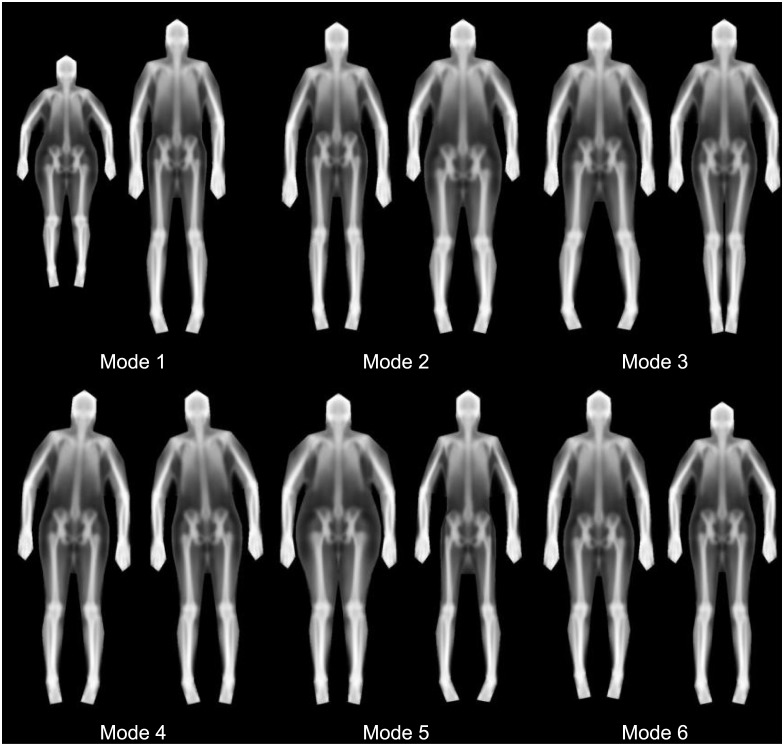
Fig 3. Shape only modes (first 6).
For each mode, the -/+ 3 standard deviation (left and right respectively) images are shown. 23 modes were required to explain 95% of shape variance. At a high level, we see that body height is captured in Mode 1, width in Mode 5, and android/gynoid shape variation in Mode 2. Note that several modes capture variation in subject pose.

