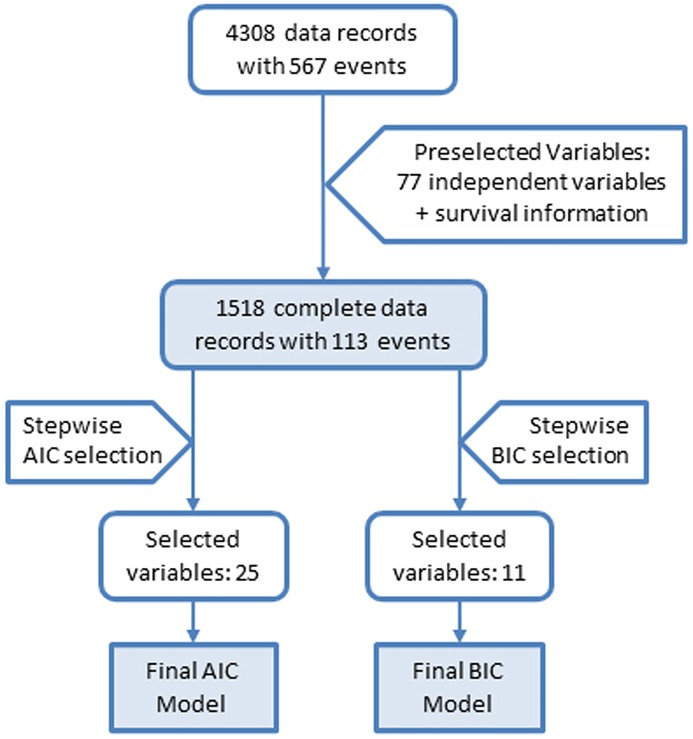
Fig 1. Flowchart for the building of the AIC and the BIC Model.
We started with 4308 data records, 77 preselected variables and two variables for “total mortality” and “follow-up time”, which are the status indicator and the follow-up time for the right-censored mortality data. Thereafter we obtained 1518 complete data records with these variables. Based on AIC and BIC criteria, we obtained two different models with 25 and 11 variables, respectively, referred to as AIC and BIC models.

