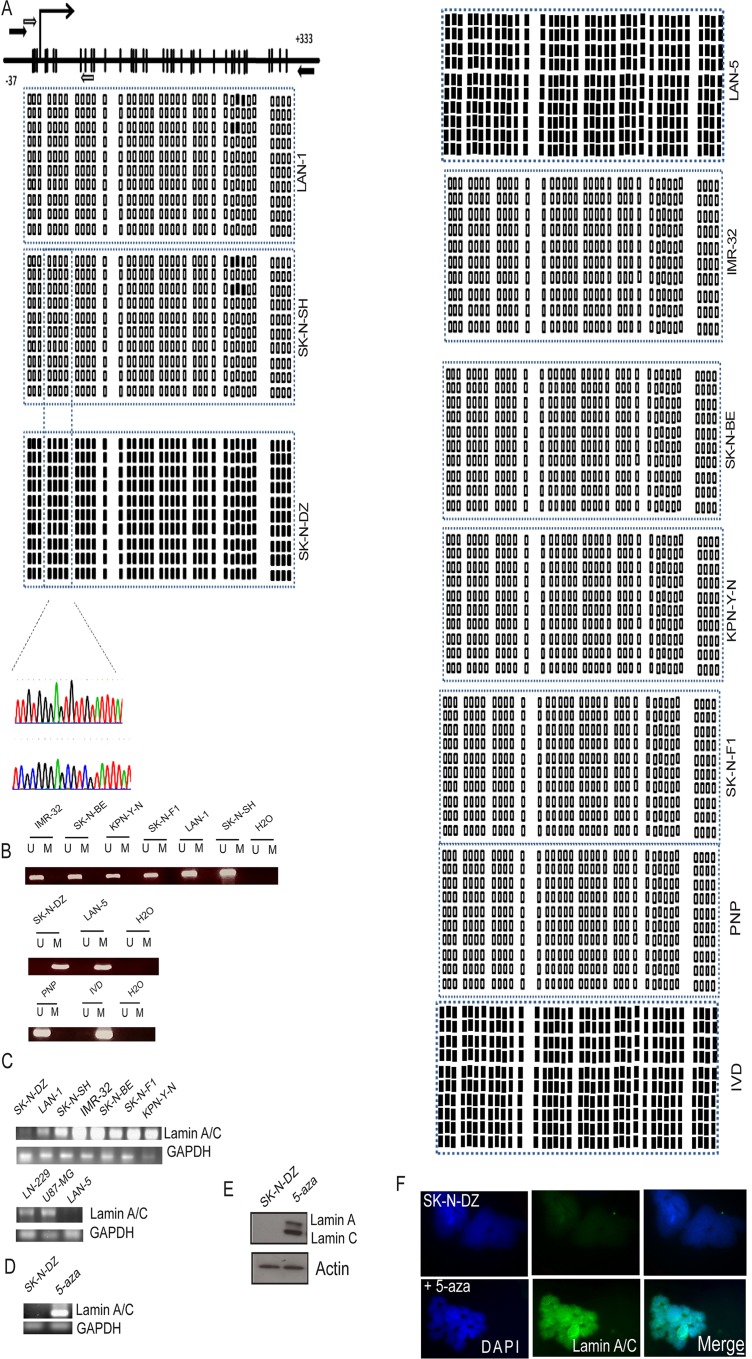
Fig 1. Methylation analysis of the Lamin A/C promoter.
RNA and protein analysis (A) Schematic of the Lamin A/C CpG Island around the transcription start site (TSS) (long black arrow). CpG dinucleotides are represented as black bars.The locations of bisulphite genomic sequencing PCR primers and methylation-specific PCR primers are indicated as white and black arrows, respectively. The bisulphite sequencing PCR (BSP)results are shown for 10 individual clones for each cancer cell line studied and primary normal human fetal brain neuronal progenitor cells(PNP) cells and IVD αs negative and positive controls, respectively.Two chromatograms are shown to compare one methylated and one unmethylated cell line. (B) Methylation-specific PCR (MSP) of the Lamin A/C gene in neuroblastoma cell lines. The presence of a PCR band under lane M indicates methylated genes, while the presence of a PCR band under lane U indicates unmethylated genes. (C) RT-PCR analysis of Lamin A/C expression. (D) Treatment with the demethylating agent 5-aza reactivated Lamin A/C gene expression in the methylated neuroblastoma SK-N-DZ cell line at the RNA level. (E-F) Treatment with 5-aza-2’ deoxycytidine (5-aza) reactivated Lamin A/C gene expression in the methylated neuroblastoma SK-N-DZ cell line at the protein level evaluated by WB and IF, respectively. GAPDH and actin were used as loading controls for RNA and protein expression, respectively. Lamin A/C is observed in green and DNA in blue (DAPI). Scale bar, 10μM.

