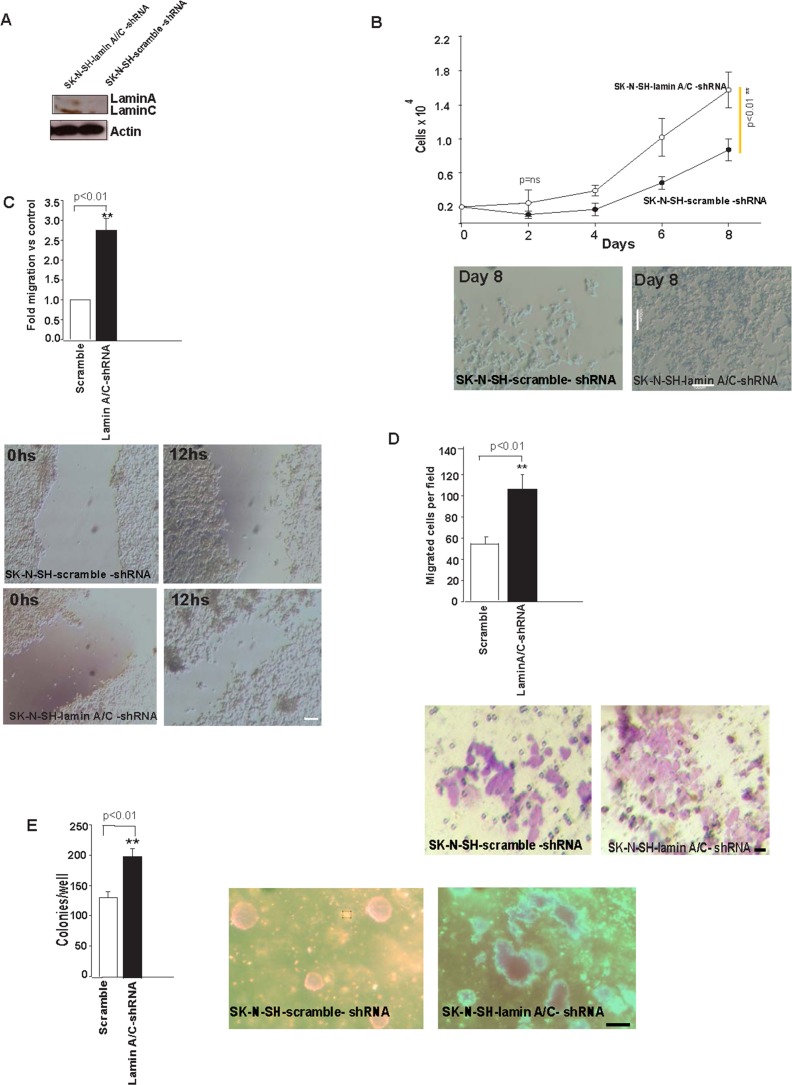
Fig 4. Lamin A/C expression silencing leads to transformation.
(A) Lamin A/C was monitored by WB after shRNA depletion by SK-N-SH-lamin-A/C-shRNA or SK-N-SH-scramble-shRNA. Actin was used as a loading control. (B) Cumulative cell numbers of SK-N-SH-lamin-A/C-shRNA and SK-N-SH-scramble-shRNA, respectively. Three independent experiments were performed in triplicate (n = 9) using cells at less than eight passages, and error bars represent the s.d. Statistical significance was assessed using Student’s t-test;(p<0.01). Representative images showing differential cell growth on day 8 of the experiment. Scale bar, 100μm. (C) Wounding assay of confluent cell layers of SK-N-SH-lamin-A/C-shRNA or SK-N-SH-scramble-shRNA.Number of cells that migrated into a delimited wound area after 12h is plotted. Cells in three defined area per group per experiment were quantified in three independent experiments with three technical replicates. Error bars represent the s.d. Statistical significance was assessed using Student’s t-test; (*p<0.01). Representative images; scale bar, 100μM. (D) Quantification of the Matrigel chamber migration assay for SK-N-SH-lamin-A/C-shRNA and SK-N-SH-scramble-shRNA. Error bars represent the s.d. (n = 9). Statistical significance was assessed by Student’s t-test; (**p<0.01). Scale bar, 10μM. (E) SK-N-SH-lamin-A/C increased the number of colonies in soft agar compared with the SK-N-SH-scramble-shRNA control. The number of colonies per well was counted and plotted. Three independent experiments (n1 = 3) with 3 replicates per experiment (n2 = 9) were performed. Error bars represent the s.d. (n = 9). Statistical significance was assessed using Student’s t-test (**p<0.01). Scale bar, 100μM.

