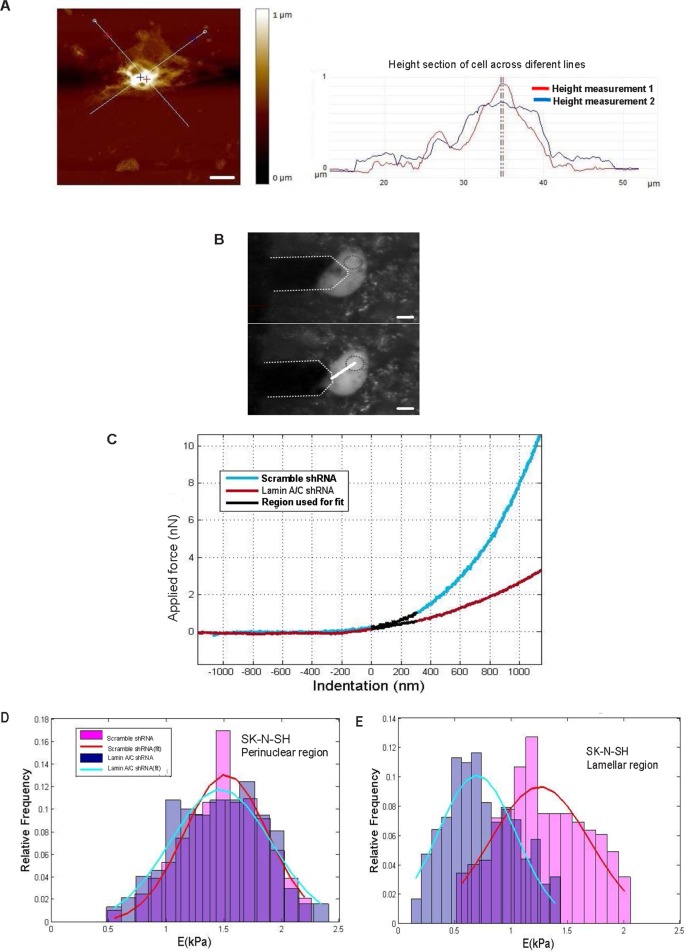
Fig 6. Changes in the mechanical properties of Lamin A/C-silenced unmethylated neuroblastoma cells.
(A) Representative optical and atomic force microscopy (AFM) images of SK-N-SH-scramble-shRNA for height measurement. The obtained image (150 x 150 μm, 512 x 512 pixel resolution, and 0.2 Hz scan rate) was used to measure the height of the cells. Scale bar, 10μM. In red and blue height profile across different lines from height AFM image are shown. (B) AFM tip positioned directly above the lamellar (lower panel) and perinuclear region (upper panel) to show we were capable of carefully selecting the region in which the force curve was obtained. (C) Typical force curves from SK-N-SH-lamin-A/C-shRNA or SK-N-SH-scramble-shRNA, and the 300-nm region of the curve used for the polynomial fit. (D) Normalized histogram of the data obtained from both groups for the perinuclear region. Each histogram was fitted with a Gaussian curve to obtain the mean value and the standard deviation of Young’s Modulus (E) A Student’s t-test confirmed that there were no significant differences between the two groups. (E) Normalized histogram of the data obtained from both groups for the lamellar region. Each histogram was fitted with a Gaussian curve to obtain the mean value and the standard deviation of E. A Student’s t-test confirmed that there were significant differences (**p<0.01).

